OPEN-SOURCE SCRIPT
Prometheus Cauchy Probability
The Cauchy probability distribution is a distribution that is better suited to be used on non normal data, such as stock returns. Markets characterized by volatility and fat-tails can be better modeled like this.
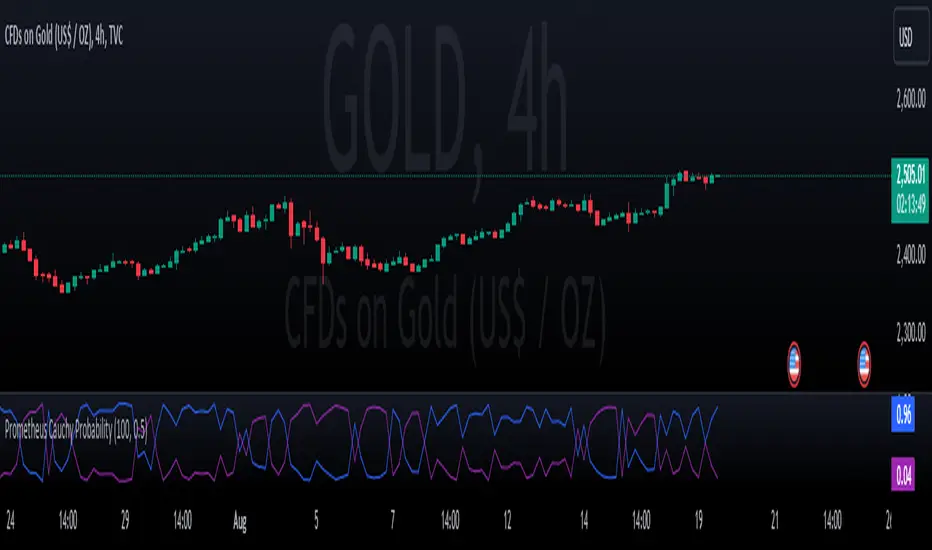
This script provides two values to a user. The blue line represents the probability for the underlying to rise. The purple line represents its probability to fall. Rise and fall by how much? By default a prediction of 0.5% is set, but users can adjust it. The script automatically calculates based on how many bars would be in an entire day. For example there are 390 minutes from 9:30am to 4:00pm est. time so the script uses 390 bars. Users have the option to set a custom bars back length.
Developer’s note. This script works best with extended market hours on. Every example shown will have it on. The more price and volatility the better!
Code breakdown:
Pine Script®
This function is what calculates the Cauchy cumulative density function.
Pine Script®
x represents the target price. x0 represents the current highest price of the day. Gamma is the standard deviation of prices over the desired length. x_lo, x0_lo, are variables to determine the probability of falling. Inputting these values into the function we get back our chance of rising and falling. Our blue and purple line.
Trade Examples:

Step 1: After a move down there is some choppiness, the values are close to each other and moving sharply.
Step 2: The chance to rise (Blue Line) strongly moves above the chance to fall (Purple Line), uptrend ensues.
Step 3: Small breaks below the purple line show breaks in the overall trend.
Step 4: Strong move down in price, and up in purple line end up trend.

Step 1: Strong cross in purple and blue line, marking the start of a downtrend.
Step 2: Small breaks above the purple line show breaks in the overall trend.
Step 3: Strong move up in price, and up in the blue line end downtrend.
Day trading example:

Custom input:
Step 1: Pre market weakness ends with a move up in the blue line and price.
Step 2: Consolidation in the uptrend with a small downtrend and above the purple line.
Step 3: Strong move up in price, and up in the blue line end consolidation and resumes strong uptrend.

This example is with custom input: 100 bars back, and 1% prediction.
Step 1: Downtrend starts after a big move up.
Step 2: Big crossover in blue and purple line. Uptrend starts.
Step 3: Lines get close signaling choppiness.
Step 4: Purple crosses over blue ending uptrend.
No indicator is 100% accurate, we encourage traders to use them along with their own discretion. Please use these tools with your own decision making. Comments about desired features and updates are encouraged!
This script provides two values to a user. The blue line represents the probability for the underlying to rise. The purple line represents its probability to fall. Rise and fall by how much? By default a prediction of 0.5% is set, but users can adjust it. The script automatically calculates based on how many bars would be in an entire day. For example there are 390 minutes from 9:30am to 4:00pm est. time so the script uses 390 bars. Users have the option to set a custom bars back length.
Developer’s note. This script works best with extended market hours on. Every example shown will have it on. The more price and volatility the better!
Code breakdown:
cauchy_cdf(x, x0, gamma)=>
1 / math.pi * math.atan((x - x0) / gamma) + 0.5
This function is what calculates the Cauchy cumulative density function.
// Calculate x and gamma
x = close * (1 + pred)
x0 = hi
gamma := ta.stdev(close, Len, false)
y = cauchy_cdf(x, x0, gamma)
//down
x_lo = close * (1 - pred)
x0_lo = lo
y_lo = cauchy_cdf(x_lo, x0_lo, gamma)
x represents the target price. x0 represents the current highest price of the day. Gamma is the standard deviation of prices over the desired length. x_lo, x0_lo, are variables to determine the probability of falling. Inputting these values into the function we get back our chance of rising and falling. Our blue and purple line.
Trade Examples:
Step 1: After a move down there is some choppiness, the values are close to each other and moving sharply.
Step 2: The chance to rise (Blue Line) strongly moves above the chance to fall (Purple Line), uptrend ensues.
Step 3: Small breaks below the purple line show breaks in the overall trend.
Step 4: Strong move down in price, and up in purple line end up trend.
Step 1: Strong cross in purple and blue line, marking the start of a downtrend.
Step 2: Small breaks above the purple line show breaks in the overall trend.
Step 3: Strong move up in price, and up in the blue line end downtrend.
Day trading example:
Custom input:
Step 1: Pre market weakness ends with a move up in the blue line and price.
Step 2: Consolidation in the uptrend with a small downtrend and above the purple line.
Step 3: Strong move up in price, and up in the blue line end consolidation and resumes strong uptrend.
This example is with custom input: 100 bars back, and 1% prediction.
Step 1: Downtrend starts after a big move up.
Step 2: Big crossover in blue and purple line. Uptrend starts.
Step 3: Lines get close signaling choppiness.
Step 4: Purple crosses over blue ending uptrend.
No indicator is 100% accurate, we encourage traders to use them along with their own discretion. Please use these tools with your own decision making. Comments about desired features and updates are encouraged!
Mã nguồn mở
Theo đúng tinh thần TradingView, tác giả của tập lệnh này đã công bố nó dưới dạng mã nguồn mở, để các nhà giao dịch có thể xem xét và xác minh chức năng. Chúc mừng tác giả! Mặc dù bạn có thể sử dụng miễn phí, hãy nhớ rằng việc công bố lại mã phải tuân theo Nội quy.
Thông báo miễn trừ trách nhiệm
Thông tin và các ấn phẩm này không nhằm mục đích, và không cấu thành, lời khuyên hoặc khuyến nghị về tài chính, đầu tư, giao dịch hay các loại khác do TradingView cung cấp hoặc xác nhận. Đọc thêm tại Điều khoản Sử dụng.