OPEN-SOURCE SCRIPT
Garman-Klass-Yang-Zhang Volatility Estimator
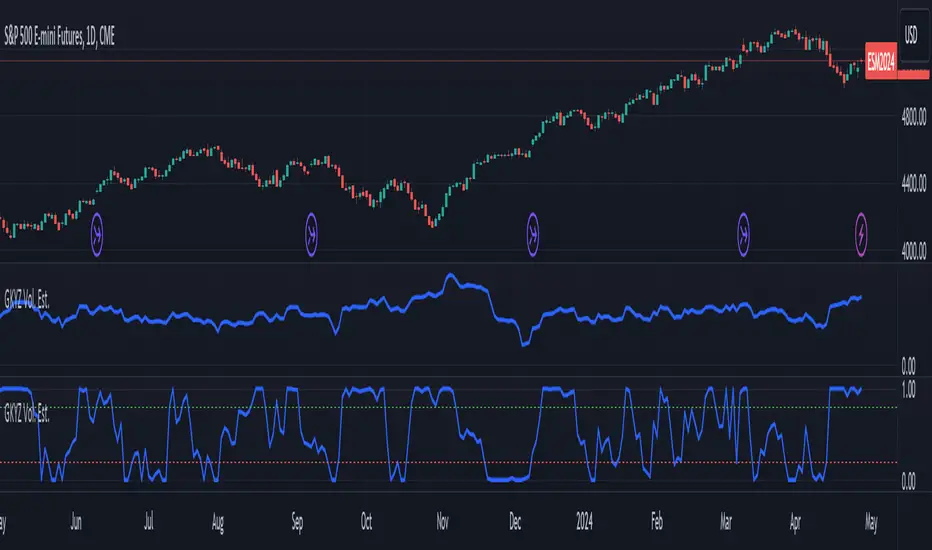
The Garman-Klass-Yang-Zhang Volatility Estimator (GKYZVE) is yet another attempt to robustly measure volatility, integrating intra-candle and inter-candle dynamics. It is an extension of the Garman-Klass Volatility Estimator (GKVE) incorporating insights from the Yang-Zhang Volatility Estimator (YZVE). Like the YZVE, the GKYZVE holistically considers open, high, low, and close prices. The formula for GKYZ is:
GKYZVE = 0.5 * σ_HL² + [(2 * math.log(2) -1)] * σ_CC² + σ_OC²
Where:
The GKYZVE differs from the YZVE by using fixed weighing factors derived from theoretical calculations, leaning heavier into the assumption that returns are log-distributed.
This script also offers a choice for normalization between 0 and 1, turning the estimator into an oscillator for comparing current volatility to recent levels. Horizontal lines at user-defined levels are also available for clearer visualization. Both options are off by default.
References:
Garman, M. B., & Klass, M. J. (1980). On the estimation of security price volatilities from historical data. The Journal of Business, 53(1), 67-78.
Yang, D., & Zhang, Q. (2000). Drift-independent volatility estimation based on high, low, open, and close prices. The Journal of Business, 73(3), 477-492.
GKYZVE = 0.5 * σ_HL² + [(2 * math.log(2) -1)] * σ_CC² + σ_OC²
Where:
- σ_HL² is the variance based on the high and low prices (σ_HL² = (high - low)² / (4 * math.log(2))), weighted at 0.5.
- σ_CC² is the close-to-close variance (σ_CC² = (close[1] - close)²), weighted at (2 ln 2) -1 for the logarithmic distribution of returns and emphasizing the impact of day-to-day price changes.
- σ_OC² is the variance of the opening price against the closing price (σ_OC² = 0.5 * (open - close)²), weighted at 1.
The GKYZVE differs from the YZVE by using fixed weighing factors derived from theoretical calculations, leaning heavier into the assumption that returns are log-distributed.
This script also offers a choice for normalization between 0 and 1, turning the estimator into an oscillator for comparing current volatility to recent levels. Horizontal lines at user-defined levels are also available for clearer visualization. Both options are off by default.
References:
Garman, M. B., & Klass, M. J. (1980). On the estimation of security price volatilities from historical data. The Journal of Business, 53(1), 67-78.
Yang, D., & Zhang, Q. (2000). Drift-independent volatility estimation based on high, low, open, and close prices. The Journal of Business, 73(3), 477-492.
Mã nguồn mở
Theo đúng tinh thần TradingView, tác giả của tập lệnh này đã công bố nó dưới dạng mã nguồn mở, để các nhà giao dịch có thể xem xét và xác minh chức năng. Chúc mừng tác giả! Mặc dù bạn có thể sử dụng miễn phí, hãy nhớ rằng việc công bố lại mã phải tuân theo Nội quy.
Thông báo miễn trừ trách nhiệm
Thông tin và các ấn phẩm này không nhằm mục đích, và không cấu thành, lời khuyên hoặc khuyến nghị về tài chính, đầu tư, giao dịch hay các loại khác do TradingView cung cấp hoặc xác nhận. Đọc thêm tại Điều khoản Sử dụng.