OPEN-SOURCE SCRIPT
Cập nhật Modified Mannarino Market Risk Indicator & Bubbles
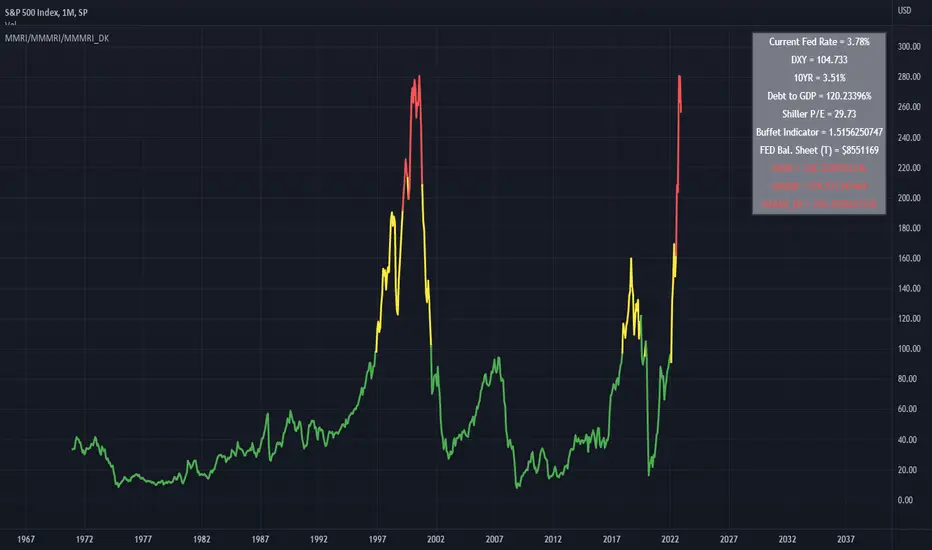
Modified Mannarino Market Risk Indicator
MMRI = DXY * 10Y Yield
MMMRI = MMRI * (Debt/GDP)
- Color Indicators
Green ~ Low Risk
Yellow - Mod Risk
Red - High Risk
Purple - Extreme Risk
*
Bubbles Formula (MMMRI_DK)
DXY*(10Y + FED Rate)* (Shiller P/E Ratio) * (Warren Buffet Indicator)*(Debt/GDP) /1.61
Similar to the Shiller P/E Ratio - you need to look back to see where the bubbles were. The difference between the Dot Com bubble and subsequent ones is that we now have QE which is why I included the FED Rate + 10Y.
*Color Indicators
Green ~ Low Risk
Yellow - Mod Risk
Red - High Risk
Purple - Extreme Risk
Future Bubbles Formula (MMMRI_DK_Fut)
DXY*(10Y + Future FED Rate)* (Shiller P/E Ratio) * (Warren Buffet Indicator)*(Debt/GDP) /1.61
Assumes that the 10Y is fixed but what is important is that you will get an idea on when the system may pop.
Phát hành các Ghi chú
Bug FixMã nguồn mở
Theo đúng tinh thần TradingView, tác giả của tập lệnh này đã công bố nó dưới dạng mã nguồn mở, để các nhà giao dịch có thể xem xét và xác minh chức năng. Chúc mừng tác giả! Mặc dù bạn có thể sử dụng miễn phí, hãy nhớ rằng việc công bố lại mã phải tuân theo Nội quy.
Thông báo miễn trừ trách nhiệm
Thông tin và các ấn phẩm này không nhằm mục đích, và không cấu thành, lời khuyên hoặc khuyến nghị về tài chính, đầu tư, giao dịch hay các loại khác do TradingView cung cấp hoặc xác nhận. Đọc thêm tại Điều khoản Sử dụng.
Mã nguồn mở
Theo đúng tinh thần TradingView, tác giả của tập lệnh này đã công bố nó dưới dạng mã nguồn mở, để các nhà giao dịch có thể xem xét và xác minh chức năng. Chúc mừng tác giả! Mặc dù bạn có thể sử dụng miễn phí, hãy nhớ rằng việc công bố lại mã phải tuân theo Nội quy.
Thông báo miễn trừ trách nhiệm
Thông tin và các ấn phẩm này không nhằm mục đích, và không cấu thành, lời khuyên hoặc khuyến nghị về tài chính, đầu tư, giao dịch hay các loại khác do TradingView cung cấp hoặc xác nhận. Đọc thêm tại Điều khoản Sử dụng.