OPEN-SOURCE SCRIPT
Cập nhật Move Magnitude Visualizer (beta)
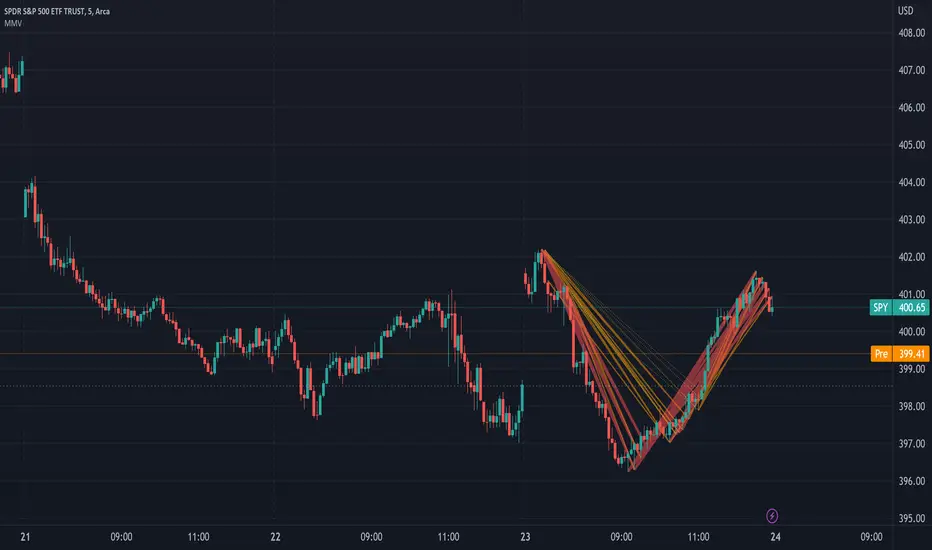
This experimental visualizer measures all price differences across a range of samples to determine what is normal for a measure of time. Based on whether a recent change in price over time has exceeded the norm, a line is drawn to indicate the magnitude/severity of that move. In short, it attempts to visualize when a move is outside the norm and when it may be risky to join that move.
In the end, I've always wanted a tool that gave me a visual warning to when a move is abnormally severe and shouldn't be trusted. RSI and other indicators only work with specific lengths, this attempt to be a deviation detector that isn't bound by length or time-frame.
- A thick red line = greater than 3 standard deviations.
- An orangish/goldish line = greater than 2 standard deviations.
- A thin dotted yellow = greater than 1 standard deviation.
In the end, I've always wanted a tool that gave me a visual warning to when a move is abnormally severe and shouldn't be trusted. RSI and other indicators only work with specific lengths, this attempt to be a deviation detector that isn't bound by length or time-frame.
- This is a work in progress, so feedback is appreciated. I don't have a strong idea yet how to properly visualize this data.
- It is very compute heavy and some users may experience timeouts. I've done everything I can think of to eliminate redundant computer and to optimize for PineScript.
Phát hành các Ghi chú
Allow for custom colors.Mã nguồn mở
Theo đúng tinh thần TradingView, tác giả của tập lệnh này đã công bố nó dưới dạng mã nguồn mở, để các nhà giao dịch có thể xem xét và xác minh chức năng. Chúc mừng tác giả! Mặc dù bạn có thể sử dụng miễn phí, hãy nhớ rằng việc công bố lại mã phải tuân theo Nội quy.
Thông báo miễn trừ trách nhiệm
Thông tin và các ấn phẩm này không nhằm mục đích, và không cấu thành, lời khuyên hoặc khuyến nghị về tài chính, đầu tư, giao dịch hay các loại khác do TradingView cung cấp hoặc xác nhận. Đọc thêm tại Điều khoản Sử dụng.
Mã nguồn mở
Theo đúng tinh thần TradingView, tác giả của tập lệnh này đã công bố nó dưới dạng mã nguồn mở, để các nhà giao dịch có thể xem xét và xác minh chức năng. Chúc mừng tác giả! Mặc dù bạn có thể sử dụng miễn phí, hãy nhớ rằng việc công bố lại mã phải tuân theo Nội quy.
Thông báo miễn trừ trách nhiệm
Thông tin và các ấn phẩm này không nhằm mục đích, và không cấu thành, lời khuyên hoặc khuyến nghị về tài chính, đầu tư, giao dịch hay các loại khác do TradingView cung cấp hoặc xác nhận. Đọc thêm tại Điều khoản Sử dụng.