OPEN-SOURCE SCRIPT
Cập nhật Bias Table
Overview
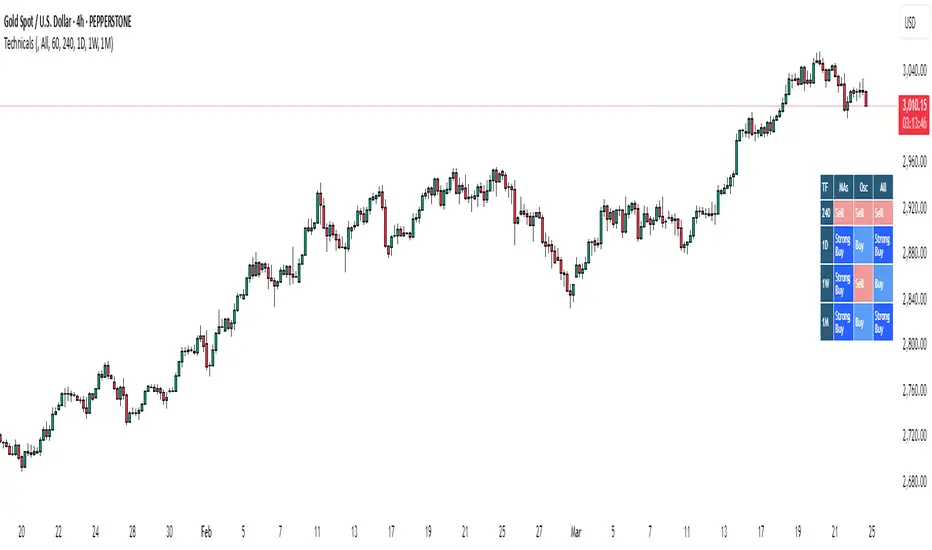
The Bias Table Indicator is a multi-timeframe analysis tool designed to provide a quick sentiment overview across multiple timeframes. It combines signals from Moving Averages (MAs) and Oscillators to determine market bias, helping traders make more informed decisions.
Key Features
✔ Multi-Timeframe Analysis (MTF) – Displays market bias across up to five timeframes.
✔ Customizable Signals – Choose whether bias is based on Moving Averages (MAs), Oscillators, or a combination of both.
✔ Visual Table Format – The indicator presents the bias as a color-coded table in the bottom-right corner of the chart for quick reference.
✔ Adjustable Colors & Display Settings – Users can customize colors for different sentiment states (Strong Buy, Buy, Neutral, Sell, Strong Sell).
How It Works
Bias Calculation: The indicator evaluates market conditions using preset values (which can be replaced with actual logic) to determine sentiment for each timeframe.
Multi-Timeframe Support: The table can display bias from hourly to monthly timeframes, giving traders a broader view of market conditions.
Customizable Signals: Users can filter the table to show bias based only on MAs, Oscillators, or a combination of both.
Interpreting the Table
📊 Timeframes: The leftmost column shows selected timeframes (e.g., 1H, 4H, 1D, 1W, 1M).
📈 Signal Columns:
MAs – Bias based on Moving Averages.
Oscillators – Bias based on momentum indicators like RSI, Stochastics, etc.
All – A combined bias based on both MAs & Oscillators.
🚦 Color-Coded Ratings:
🔵 Strong Buy – High bullish strength.
🔹 Buy – Moderate bullish sentiment.
⚪ Neutral – No clear trend.
🔸 Sell – Moderate bearish sentiment.
🔴 Strong Sell – High bearish strength.
Best Used For:
📈 Trend Confirmation: Validate signals from your primary strategy.
⏳ Multi-Timeframe Analysis: See whether short-term and long-term trends align.
⚡ Quick Sentiment Check: Get a high-level view of market conditions without analyzing multiple indicators separately.
Customization Options:
Select which timeframes to include in the table.
Choose whether to base bias on MAs, Oscillators, or both.
Adjust colors for each signal type.
Phát hành các Ghi chú
OverviewThe Bias Table Indicator is a multi-timeframe analysis tool designed to provide a quick sentiment overview across multiple timeframes. It combines signals from Moving Averages (MAs) and Oscillators to determine market bias, helping traders make more informed decisions.
Key Features
✔ Multi-Timeframe Analysis (MTF) – Displays market bias across up to five timeframes.
✔ Customizable Signals – Choose whether bias is based on Moving Averages (MAs), Oscillators, or a combination of both.
✔ Visual Table Format – The indicator presents the bias as a color-coded table in the bottom-right corner of the chart for quick reference.
✔ Adjustable Colors & Display Settings – Users can customize colors for different sentiment states (Strong Buy, Buy, Neutral, Sell, Strong Sell).
How It Works
Bias Calculation: The indicator evaluates market conditions using preset values (which can be replaced with actual logic) to determine sentiment for each timeframe.
Multi-Timeframe Support: The table can display bias from hourly to monthly timeframes, giving traders a broader view of market conditions.
Customizable Signals: Users can filter the table to show bias based only on MAs, Oscillators, or a combination of both.
Interpreting the Table
📊 Timeframes: The leftmost column shows selected timeframes (e.g., 1H, 4H, 1D, 1W, 1M).
📈 Signal Columns:
MAs – Bias based on Moving Averages.
Oscillators – Bias based on momentum indicators like RSI, Stochastics, etc.
All – A combined bias based on both MAs & Oscillators.
🚦 Color-Coded Ratings:
🔵 Strong Buy – High bullish strength.
🔹 Buy – Moderate bullish sentiment.
⚪ Neutral – No clear trend.
🔸 Sell – Moderate bearish sentiment.
🔴 Strong Sell – High bearish strength.
Best Used For:
📈 Trend Confirmation: Validate signals from your primary strategy.
⏳ Multi-Timeframe Analysis: See whether short-term and long-term trends align.
⚡ Quick Sentiment Check: Get a high-level view of market conditions without analyzing multiple indicators separately.
Customization Options:
Select which timeframes to include in the table.
Choose whether to base bias on MAs, Oscillators, or both.
Adjust colors for each signal type.
Mã nguồn mở
Theo đúng tinh thần TradingView, tác giả của tập lệnh này đã công bố nó dưới dạng mã nguồn mở, để các nhà giao dịch có thể xem xét và xác minh chức năng. Chúc mừng tác giả! Mặc dù bạn có thể sử dụng miễn phí, hãy nhớ rằng việc công bố lại mã phải tuân theo Nội quy.
Thông báo miễn trừ trách nhiệm
Thông tin và các ấn phẩm này không nhằm mục đích, và không cấu thành, lời khuyên hoặc khuyến nghị về tài chính, đầu tư, giao dịch hay các loại khác do TradingView cung cấp hoặc xác nhận. Đọc thêm tại Điều khoản Sử dụng.