OPEN-SOURCE SCRIPT
Cập nhật Map Multiple QQQ Levels to NQ (Custom Labels)
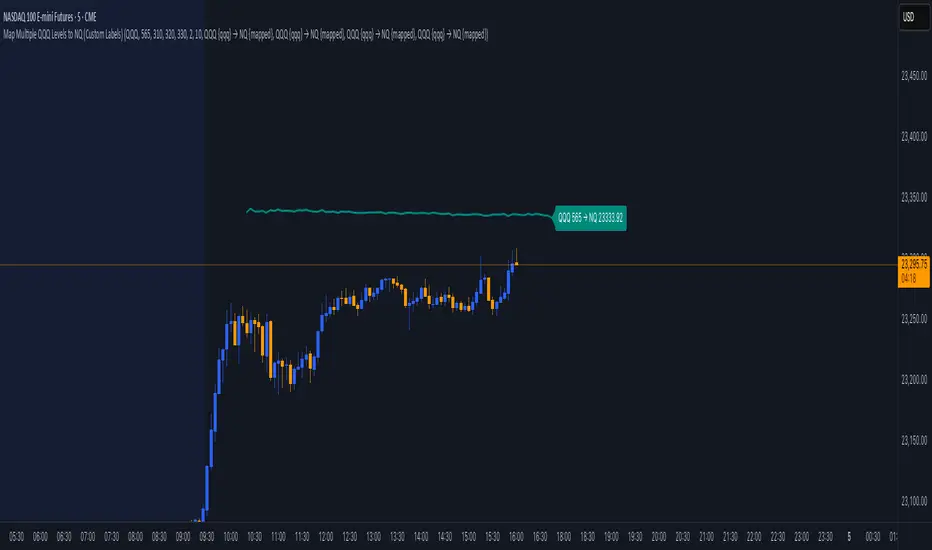
maps user-defined price levels from the QQQ (Invesco QQQ Trust, tracking the NASDAQ-100) to equivalent levels on the NQ (NASDAQ-100 futures) chart, displaying them as colored lines with optional labels. It’s designed to overlay on the NQ chart, helping traders visualize QQQ price levels in terms of NQ values based on the ratio between their prices.
Key Features:
Inputs for QQQ Levels: Users can specify up to four QQQ price levels (default: 300, 310, 320, 330) with a step of 0.1 for precision.
Customizable Appearance: Each level has its own color (default: teal, orange, purple, green) and a shared line width (default: 2).
Time Filters:
Option to display levels only for the current day (show_today_only).
Option to show levels only after 9:30 AM Eastern Time (show_after_open), aligning with market open.
Custom Labels: Each level can have a toggleable label with a customizable template (e.g., "QQQ {qqq} → NQ {mapped}"), showing the QQQ level and its mapped NQ value, formatted to two decimal places.
Dynamic Mapping: Calculates the ratio between NQ and QQQ closing prices to map QQQ levels to NQ equivalents in real-time.
Conditional Display: Levels are plotted only when user-defined conditions (day and time filters) are met, otherwise hidden (na).
Label Placement: Labels are displayed on the last confirmed historical bar, unaffected by time filters, ensuring visibility without cluttering real-time bars.
Phát hành các Ghi chú
update chart imagePhát hành các Ghi chú
update label distanceMã nguồn mở
Theo đúng tinh thần TradingView, tác giả của tập lệnh này đã công bố nó dưới dạng mã nguồn mở, để các nhà giao dịch có thể xem xét và xác minh chức năng. Chúc mừng tác giả! Mặc dù bạn có thể sử dụng miễn phí, hãy nhớ rằng việc công bố lại mã phải tuân theo Nội quy.
Thông báo miễn trừ trách nhiệm
Thông tin và các ấn phẩm này không nhằm mục đích, và không cấu thành, lời khuyên hoặc khuyến nghị về tài chính, đầu tư, giao dịch hay các loại khác do TradingView cung cấp hoặc xác nhận. Đọc thêm tại Điều khoản Sử dụng.
Mã nguồn mở
Theo đúng tinh thần TradingView, tác giả của tập lệnh này đã công bố nó dưới dạng mã nguồn mở, để các nhà giao dịch có thể xem xét và xác minh chức năng. Chúc mừng tác giả! Mặc dù bạn có thể sử dụng miễn phí, hãy nhớ rằng việc công bố lại mã phải tuân theo Nội quy.
Thông báo miễn trừ trách nhiệm
Thông tin và các ấn phẩm này không nhằm mục đích, và không cấu thành, lời khuyên hoặc khuyến nghị về tài chính, đầu tư, giao dịch hay các loại khác do TradingView cung cấp hoặc xác nhận. Đọc thêm tại Điều khoản Sử dụng.