OPEN-SOURCE SCRIPT
OHLC OLHC - Monthly, Weekly, Daily and Hourly
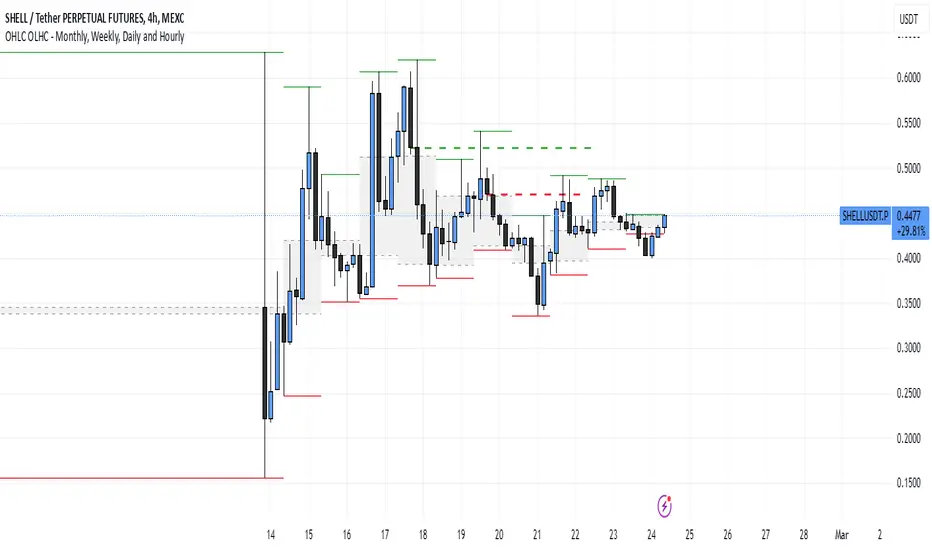
This indicator plots the previous day's (or any selected timeframe’s) Open, High, Low, and Close (OHLC) levels on the current chart. It helps traders analyze historical price levels to identify support and resistance zones.
Key Features:
Multi-Timeframe Support:
Users can select a timeframe (D, W, M, etc.) to fetch previous OHLC data.
The script requests OHLC values from the selected timeframe and overlays them on the current chart.
Customizable Display Options:
Users can choose to display only the last OHLC levels instead of all past session levels.
Users can extend the OHLC lines across the chart.
Background Highlighting:
The script fills the background only for the Previous Open and Previous Close levels, making them visually distinct.
Previous High and Low levels do not have background color.
This script is particularly useful for day traders and swing traders who rely on key price levels to make trading decisions. Let me know if you need further refinements!
Mã nguồn mở
Theo đúng tinh thần TradingView, tác giả của tập lệnh này đã công bố nó dưới dạng mã nguồn mở, để các nhà giao dịch có thể xem xét và xác minh chức năng. Chúc mừng tác giả! Mặc dù bạn có thể sử dụng miễn phí, hãy nhớ rằng việc công bố lại mã phải tuân theo Nội quy.
Thông báo miễn trừ trách nhiệm
Thông tin và các ấn phẩm này không nhằm mục đích, và không cấu thành, lời khuyên hoặc khuyến nghị về tài chính, đầu tư, giao dịch hay các loại khác do TradingView cung cấp hoặc xác nhận. Đọc thêm tại Điều khoản Sử dụng.