OPEN-SOURCE SCRIPT
Cập nhật Multi-Timeframe Trend Table - DOTAN
Multi Timeframe Trend Signal table - Wizord_KS
"Multi-Timeframe Trend Table"
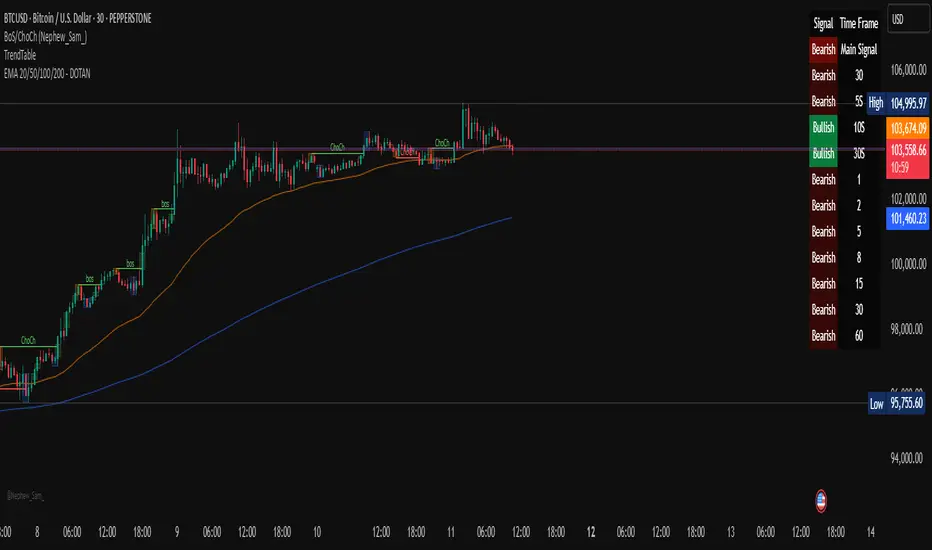
This Pine Script indicator displays a table on the TradingView chart that shows the trend direction (Bullish/Bearish) across multiple timeframes. The trend is determined using a Simple Moving Average (SMA).
🔹 Key Features of the Script
Calculates trend direction based on SMA for:
The current timeframe.
10 different user-defined timeframes.
Determines a "Main Signal" based on trend strength:
Counts the number of bullish and bearish trends across all timeframes.
Uses this count to generate an overall market sentiment (Bullish, Bearish, or Neutral).
The strength of the main signal determines its background transparency.
Displays a table in the top-right corner of the chart showing:
The main trend signal (aggregated from multiple timeframes).
The trend for the current timeframe.
The trend for each of the 10 selected timeframes.
"Multi-Timeframe Trend Table"
This Pine Script indicator displays a table on the TradingView chart that shows the trend direction (Bullish/Bearish) across multiple timeframes. The trend is determined using a Simple Moving Average (SMA).
🔹 Key Features of the Script
Calculates trend direction based on SMA for:
The current timeframe.
10 different user-defined timeframes.
Determines a "Main Signal" based on trend strength:
Counts the number of bullish and bearish trends across all timeframes.
Uses this count to generate an overall market sentiment (Bullish, Bearish, or Neutral).
The strength of the main signal determines its background transparency.
Displays a table in the top-right corner of the chart showing:
The main trend signal (aggregated from multiple timeframes).
The trend for the current timeframe.
The trend for each of the 10 selected timeframes.
Phát hành các Ghi chú
Some updates for the interface.Mã nguồn mở
Theo đúng tinh thần TradingView, tác giả của tập lệnh này đã công bố nó dưới dạng mã nguồn mở, để các nhà giao dịch có thể xem xét và xác minh chức năng. Chúc mừng tác giả! Mặc dù bạn có thể sử dụng miễn phí, hãy nhớ rằng việc công bố lại mã phải tuân theo Nội quy.
Thông báo miễn trừ trách nhiệm
Thông tin và các ấn phẩm này không nhằm mục đích, và không cấu thành, lời khuyên hoặc khuyến nghị về tài chính, đầu tư, giao dịch hay các loại khác do TradingView cung cấp hoặc xác nhận. Đọc thêm tại Điều khoản Sử dụng.
Mã nguồn mở
Theo đúng tinh thần TradingView, tác giả của tập lệnh này đã công bố nó dưới dạng mã nguồn mở, để các nhà giao dịch có thể xem xét và xác minh chức năng. Chúc mừng tác giả! Mặc dù bạn có thể sử dụng miễn phí, hãy nhớ rằng việc công bố lại mã phải tuân theo Nội quy.
Thông báo miễn trừ trách nhiệm
Thông tin và các ấn phẩm này không nhằm mục đích, và không cấu thành, lời khuyên hoặc khuyến nghị về tài chính, đầu tư, giao dịch hay các loại khác do TradingView cung cấp hoặc xác nhận. Đọc thêm tại Điều khoản Sử dụng.