OPEN-SOURCE SCRIPT
MA Direction Histogram
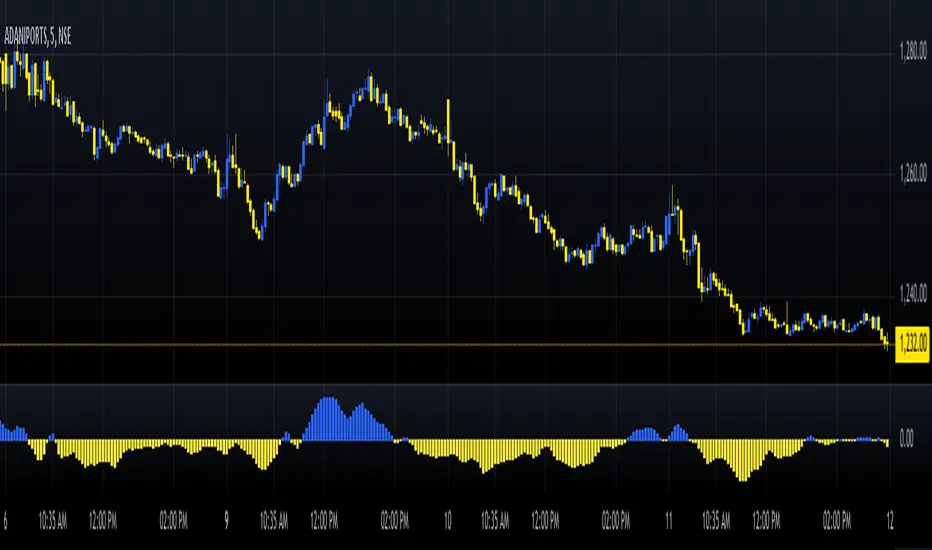
The MA Direction Histogram is a simple yet powerful tool for visualizing the momentum of a moving average (MA). It highlights whether the MA is trending up or down, making it ideal for identifying market direction quickly.
Key Features:
1. Custom MA Options: Choose from SMA, EMA, WMA, VWMA, or HMA for flexible analysis.
2. Momentum Visualization: Bars show the difference between the MA and its value from a lookback period.
- Blue Bars: Upward momentum.
- Yellow Bars: Downward momentum.
3. Easy Customization: Adjust the MA length, lookback period, and data source.
How to Use:
- Confirm Trends: Positive bars indicate uptrends; negative bars suggest downtrends.
- *Spot Reversals: Look for bar color changes as potential reversal signals.
Compact, intuitive, and versatile, the "MA Direction Histogram" helps traders stay aligned with market momentum. Perfect for trend-based strategies!
Mã nguồn mở
Theo đúng tinh thần TradingView, tác giả của tập lệnh này đã công bố nó dưới dạng mã nguồn mở, để các nhà giao dịch có thể xem xét và xác minh chức năng. Chúc mừng tác giả! Mặc dù bạn có thể sử dụng miễn phí, hãy nhớ rằng việc công bố lại mã phải tuân theo Nội quy.
Thông báo miễn trừ trách nhiệm
Thông tin và các ấn phẩm này không nhằm mục đích, và không cấu thành, lời khuyên hoặc khuyến nghị về tài chính, đầu tư, giao dịch hay các loại khác do TradingView cung cấp hoặc xác nhận. Đọc thêm tại Điều khoản Sử dụng.