OPEN-SOURCE SCRIPT
Capiba Directional Momentum Oscillator (ADX-based)
🇬🇧 English
Summary
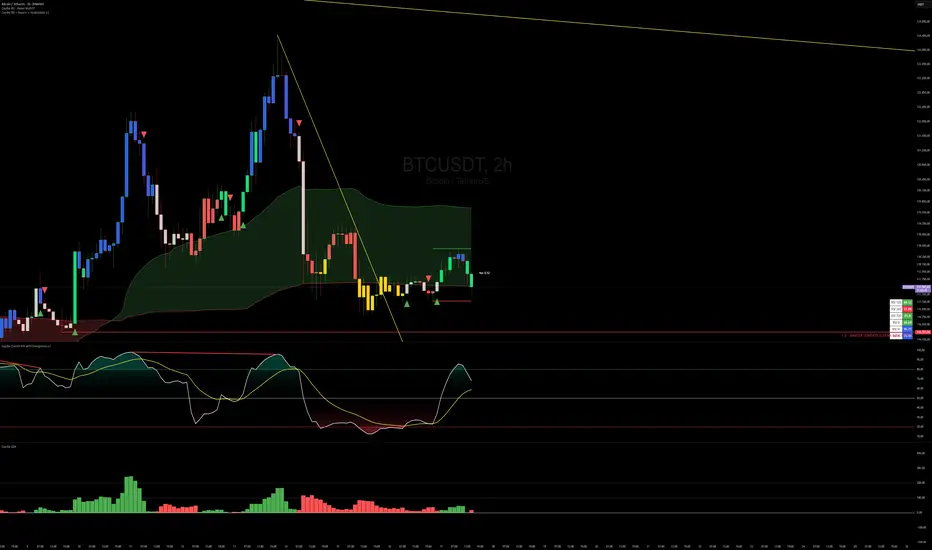
The Capiba ADX is a momentum oscillator that transforms the classic ADX (Average Directional Index) into a much more intuitive visual tool. Instead of analyzing three separate lines (ADX, DI+, DI-), this indicator consolidates the strength and direction of the trend into a single histogram that oscillates around the zero line.
The result is a clear and immediate reading of market sentiment, allowing traders to quickly identify who is in control—buyers or sellers—and with what intensity.
How to Interpret and Use the Indicator
The operation of the Capiba ADX is straightforward:
Green Histogram (Above Zero): Indicates that buying pressure (DI+) is in control. The height of the bar represents the magnitude of the bullish momentum. Taller green bars suggest a stronger uptrend.
Red Histogram (Below Zero): Indicates that selling pressure (DI-) is in control. The "depth" of the bar represents the magnitude of the bearish momentum. Lower (more negative) red bars suggest a stronger downtrend.
Zero Line (White): This is the equilibrium point. Crossovers through the zero line signal a potential shift in trend control.
Crossover Above: Buyers are taking control.
Crossover Below: Sellers are taking control.
Reference Levels (Momentum Strength)
The indicator plots three fixed reference levels to help gauge the intensity of the move:
0 Line: Equilibrium.
100 Line: Signals significant directional momentum. When the histogram surpasses this level, the trend (whether bullish or bearish) is gaining considerable strength.
200 Line: Signals very strong directional momentum, or even potential exhaustion conditions. Moves that reach this level are powerful but may also precede a consolidation or reversal.
Usage Strategy
Trend Confirmation: Use the indicator to confirm the direction of your analysis. If you are looking for long positions, the Capiba ADX should ideally be green and, preferably, rising.
Strength Identification: Watch for the histogram to cross the 100 and 200 levels to validate the strength of a breakout or an established trend.
Entry/Exit Signals: A zero-line crossover can be used as a primary entry or exit signal, especially when confirmed by other technical analysis tools.
Acknowledgements
This indicator is the result of adapting knowledge and open-source codes shared by the vibrant TradingView community.
Mã nguồn mở
Theo đúng tinh thần TradingView, tác giả của tập lệnh này đã công bố nó dưới dạng mã nguồn mở, để các nhà giao dịch có thể xem xét và xác minh chức năng. Chúc mừng tác giả! Mặc dù bạn có thể sử dụng miễn phí, hãy nhớ rằng việc công bố lại mã phải tuân theo Nội quy.
Thông báo miễn trừ trách nhiệm
Thông tin và các ấn phẩm này không nhằm mục đích, và không cấu thành, lời khuyên hoặc khuyến nghị về tài chính, đầu tư, giao dịch hay các loại khác do TradingView cung cấp hoặc xác nhận. Đọc thêm tại Điều khoản Sử dụng.