OPEN-SOURCE SCRIPT
Cập nhật Market Monitor
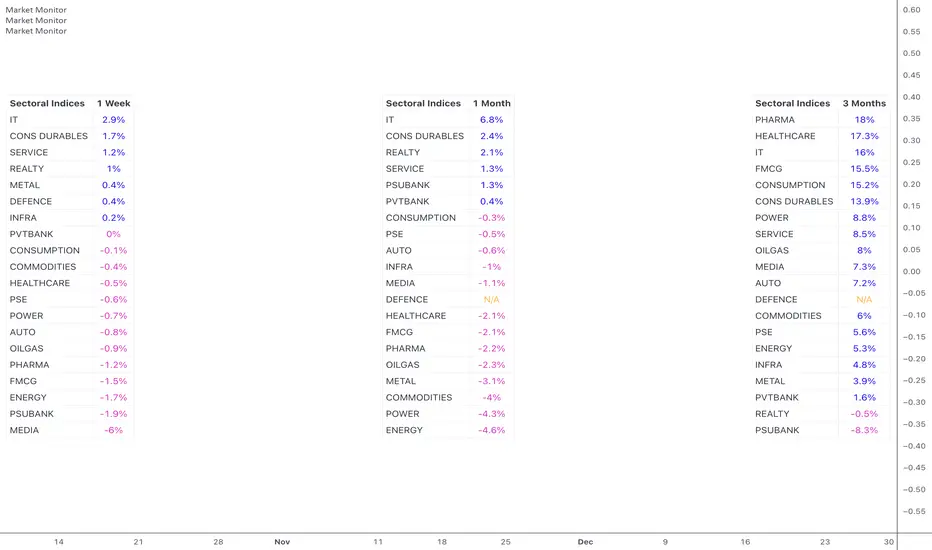
Overview
The Market Monitor Indicator provides a customisable view of dynamic percentage changes across selected indices or sectors, calculated by comparing current and previous closing prices over the chosen timeframe.
Key Features

Customisation
Use Cases
The Market Monitor Indicator provides a customisable view of dynamic percentage changes across selected indices or sectors, calculated by comparing current and previous closing prices over the chosen timeframe.
Key Features
- Choose up to 20 predefined indices or your own selected indices/stocks.
- Use checkboxes to show or hide individual entries.
- Monitor returns over daily, weekly, monthly, quarterly, half-yearly, or yearly timeframes
- Sort by returns (descending) to quickly identify top-performing indices or alphabetically for an organised and systematic review.
Customisation
- Switch between Light Mode (Blue or Green themes) and Dark Mode for visual clarity.
- Adjust the table’s size, position, and location.
- Customise the table title to your own choice e.g. Sectoral, Broad, Portfolio etc.
Use Cases
- Use multiple instances of the script with varying timeframes to study sectoral rotation and trends.
- Customise the stocks to see your portfolio returns for the day or over the past week, or longer.
Phát hành các Ghi chú
- Option to give custom titles to chosen indices. Can be used when a spread of stocks is used to create a custom index.
- Ascending sorting also added.
- Alphabetical sorting disabled for custom titles.
Phát hành các Ghi chú
- The script can now be shifted horizontally using a custom offfset value. This allows us more than 3 iterations of the table on one chart using multiple script instances.
- Alphabetical sorting is now possible in custom names too.
Mã nguồn mở
Theo đúng tinh thần TradingView, tác giả của tập lệnh này đã công bố nó dưới dạng mã nguồn mở, để các nhà giao dịch có thể xem xét và xác minh chức năng. Chúc mừng tác giả! Mặc dù bạn có thể sử dụng miễn phí, hãy nhớ rằng việc công bố lại mã phải tuân theo Nội quy.
Thông báo miễn trừ trách nhiệm
Thông tin và các ấn phẩm này không nhằm mục đích, và không cấu thành, lời khuyên hoặc khuyến nghị về tài chính, đầu tư, giao dịch hay các loại khác do TradingView cung cấp hoặc xác nhận. Đọc thêm tại Điều khoản Sử dụng.