OPEN-SOURCE SCRIPT
Long Term: Cumulative Moving Average
Who to use?
This indicator is for Long Term Investors or for Position trading and not for Day traders.
What time-frame to use?
• Daily, Weekly or Monthly
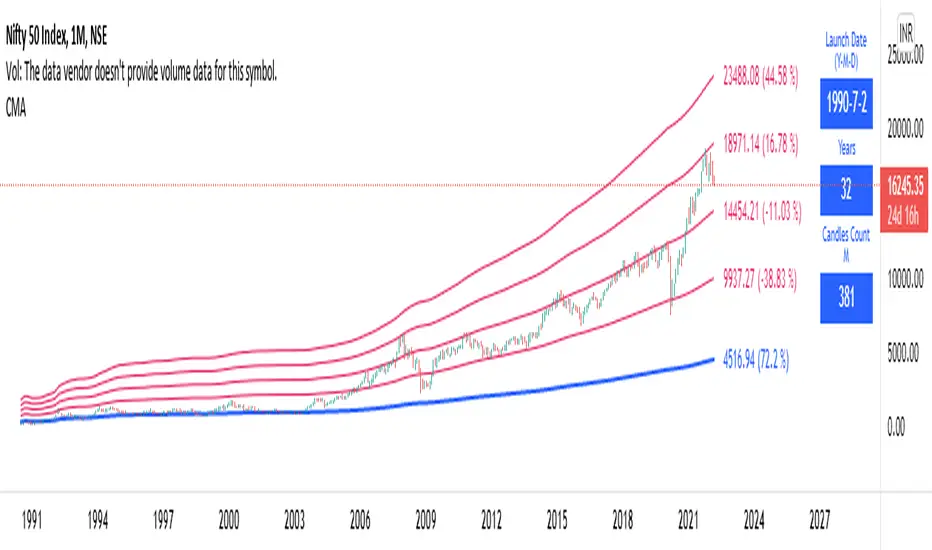
What is Blue line?
• Blue line is Cumulative Moving Average. It is cumulative sum of closing price.
• It is a trend reversal level.
• It is a strong support level.
• If price is below Blue line better not to take any Long position until it crosses above it.
What are Red lines?
• Red lines are Multiplier levels.
• These are target levels to exit the position.
• It can be breakout or pull back levels.
• The level combination numbers can be fully odd or even numbers.
• For example in certain stocks the working levels will be 1x, 3x, 5x etc., in others it will be even numbers like 2x, 4x, 6x etc.
• In some cases the levels need to be tweaked with custom decimals like 1.1x, 2.1x, 3.1x, 4.1x etc. to align the support & resistance levels.
How to use?
Entry
• Enter when the Price reach closer to the Blue line.
• Enter Long when the Price takes a pullback or breakout at the Red lines.
Exit
• Exit position when the Price reach closer to the Red lines in Long positions.
Indicator Menu
• Works only in higher time-frames like D, W & M.
• Will not work in Lower time-frames less than "D" or the Launch Date shows wrong in Lower time-frames.
Multipliers:
(Read above What are Red lines?)
Launch Date:
• Launch Date: Starting date of stock when it appeared in the exchange. Works only in D, W & M timeframes.
• Years: Total number of years from the Launch Date. Accurate date will be shown in Daily timeframe.
• Candles Count: Total number of candles from the Launch Date in the current timeframe.
Labels:
• First number is last traded price.
• Second number in () is percentage change from last traded price to that level.
This indicator is for Long Term Investors or for Position trading and not for Day traders.
What time-frame to use?
• Daily, Weekly or Monthly
What is Blue line?
• Blue line is Cumulative Moving Average. It is cumulative sum of closing price.
• It is a trend reversal level.
• It is a strong support level.
• If price is below Blue line better not to take any Long position until it crosses above it.
What are Red lines?
• Red lines are Multiplier levels.
• These are target levels to exit the position.
• It can be breakout or pull back levels.
• The level combination numbers can be fully odd or even numbers.
• For example in certain stocks the working levels will be 1x, 3x, 5x etc., in others it will be even numbers like 2x, 4x, 6x etc.
• In some cases the levels need to be tweaked with custom decimals like 1.1x, 2.1x, 3.1x, 4.1x etc. to align the support & resistance levels.
How to use?
Entry
• Enter when the Price reach closer to the Blue line.
• Enter Long when the Price takes a pullback or breakout at the Red lines.
Exit
• Exit position when the Price reach closer to the Red lines in Long positions.
Indicator Menu
• Works only in higher time-frames like D, W & M.
• Will not work in Lower time-frames less than "D" or the Launch Date shows wrong in Lower time-frames.
Multipliers:
(Read above What are Red lines?)
Launch Date:
• Launch Date: Starting date of stock when it appeared in the exchange. Works only in D, W & M timeframes.
• Years: Total number of years from the Launch Date. Accurate date will be shown in Daily timeframe.
• Candles Count: Total number of candles from the Launch Date in the current timeframe.
Labels:
• First number is last traded price.
• Second number in () is percentage change from last traded price to that level.
Mã nguồn mở
Theo đúng tinh thần TradingView, tác giả của tập lệnh này đã công bố nó dưới dạng mã nguồn mở, để các nhà giao dịch có thể xem xét và xác minh chức năng. Chúc mừng tác giả! Mặc dù bạn có thể sử dụng miễn phí, hãy nhớ rằng việc công bố lại mã phải tuân theo Nội quy.
Thông báo miễn trừ trách nhiệm
Thông tin và các ấn phẩm này không nhằm mục đích, và không cấu thành, lời khuyên hoặc khuyến nghị về tài chính, đầu tư, giao dịch hay các loại khác do TradingView cung cấp hoặc xác nhận. Đọc thêm tại Điều khoản Sử dụng.