OPEN-SOURCE SCRIPT
Multi-TF EMA 5/8-ChartTicker-Dashboard
⚙️ Key Components
Timeframes & Weights
Uses 5 different intraday timeframes: 2m, 5m, 15m, 30m, 60m.
Each TF has a weight:
2m = 1
5m = 2
15m = 4
30m = 8
60m = 16
👉 Higher timeframe signals contribute more to the total.
Signal Logic per Timeframe
For each TF, calculate EMA 5 and EMA 8.
If EMA5 > EMA8 → Buy (B, +1).
If EMA5 < EMA8 → Sell (S, –1).
Total Score Calculation
Each signal (+1 or –1) is multiplied by its timeframe weight.
All weighted signals are summed into a total score.
Positive = bullish bias, negative = bearish bias.
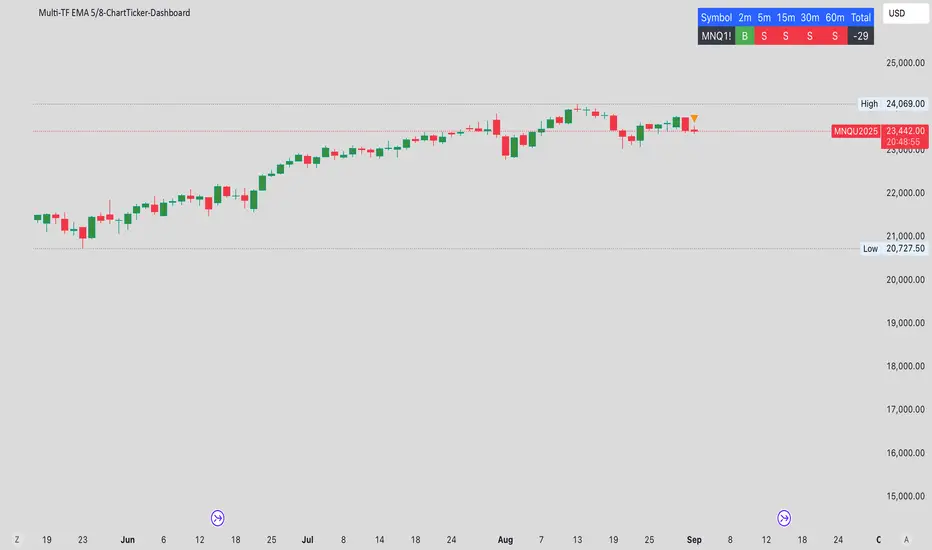
Dashboard Table (top-right corner)
Row 1 (header): Symbol, each timeframe (2m, 5m, 15m, 30m, 60m), Total.
Row 2 (values):
Symbol name.
B (green) or S (red) per timeframe.
Weighted Total score.
🛠️ Overall Function
This indicator is essentially a multi-timeframe EMA trend dashboard that:
Shows Buy/Sell alignment across multiple TFs.
Provides a weighted trend score to quickly assess market bias.
Makes it easy to spot whether short- and long-term signals agree or conflict.
Timeframes & Weights
Uses 5 different intraday timeframes: 2m, 5m, 15m, 30m, 60m.
Each TF has a weight:
2m = 1
5m = 2
15m = 4
30m = 8
60m = 16
👉 Higher timeframe signals contribute more to the total.
Signal Logic per Timeframe
For each TF, calculate EMA 5 and EMA 8.
If EMA5 > EMA8 → Buy (B, +1).
If EMA5 < EMA8 → Sell (S, –1).
Total Score Calculation
Each signal (+1 or –1) is multiplied by its timeframe weight.
All weighted signals are summed into a total score.
Positive = bullish bias, negative = bearish bias.
Dashboard Table (top-right corner)
Row 1 (header): Symbol, each timeframe (2m, 5m, 15m, 30m, 60m), Total.
Row 2 (values):
Symbol name.
B (green) or S (red) per timeframe.
Weighted Total score.
🛠️ Overall Function
This indicator is essentially a multi-timeframe EMA trend dashboard that:
Shows Buy/Sell alignment across multiple TFs.
Provides a weighted trend score to quickly assess market bias.
Makes it easy to spot whether short- and long-term signals agree or conflict.
Mã nguồn mở
Theo đúng tinh thần TradingView, người tạo ra tập lệnh này đã biến tập lệnh thành mã nguồn mở để các nhà giao dịch có thể xem xét và xác minh công năng. Xin dành lời khen tặng cho tác giả! Mặc dù bạn có thể sử dụng miễn phí, nhưng lưu ý nếu đăng lại mã, bạn phải tuân theo Quy tắc nội bộ của chúng tôi.
Thông báo miễn trừ trách nhiệm
Thông tin và ấn phẩm không có nghĩa là và không cấu thành, tài chính, đầu tư, kinh doanh, hoặc các loại lời khuyên hoặc khuyến nghị khác được cung cấp hoặc xác nhận bởi TradingView. Đọc thêm trong Điều khoản sử dụng.