OPEN-SOURCE SCRIPT
Cập nhật Better RSI
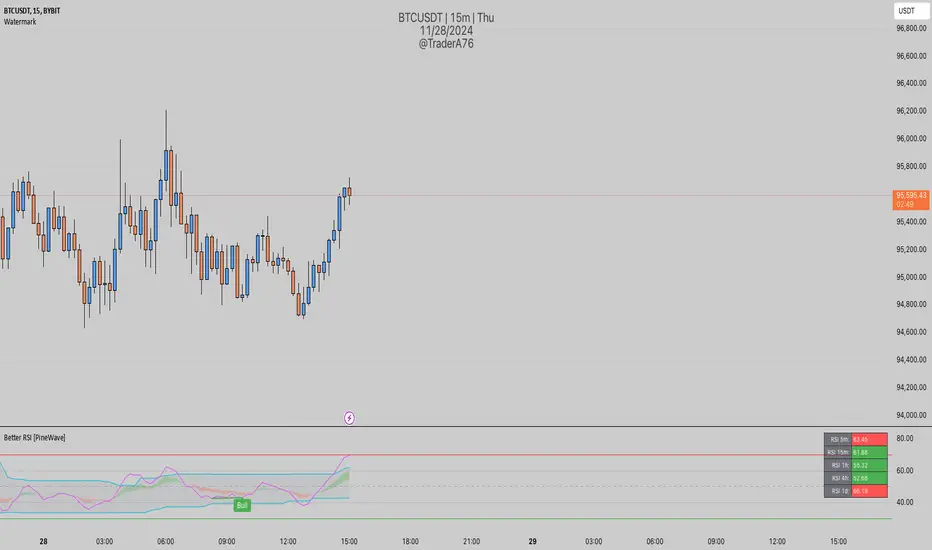
This script is an enhancement of the original RSI (Relative Strength Index) indicator for TradingView. While the core RSI functionality remains intact, several powerful features have been added to make it a "Better RSI" tool for traders and investors.
Key Features:
1. Divergence Detection: The script now includes both Bullish and Hidden Divergence detection. Bullish Divergence helps identify potential trend reversals when the price makes lower lows, but the RSI makes higher lows. Conversely, Hidden Divergence highlights instances where the RSI and price move in opposite directions, signaling potential trend continuation or reversal.
2. Bollinger Band Breakout Highlight: Users have the option to select "Bollinger Bands" as the Moving Average (MA) type in the settings. When enabled, this feature highlights RSI-Bollinger Band breakouts. It's a valuable tool for traders looking to capitalize on RSI movements in conjunction with Bollinger Bands.
3. Customizable Settings: The script provides a range of customizable settings, allowing you to adjust parameters like RSI length, MA type, Bollinger Bands standard deviation, and more to suit your trading strategy.
4. Clear Visuals: The script offers clear visual cues, with colored backgrounds indicating RSI overbought and oversold levels, as well as extreme breakouts. Bullish and bearish divergence points are also marked with distinct crosses, making it easy to spot potential trading opportunities.
Whether you're a seasoned trader or just starting, the "Better RSI" script empowers you with advanced tools to make more informed trading decisions. Use it to identify potential trend reversals, continuation patterns, and RSI-Bollinger Band breakouts in the market.
Phát hành các Ghi chú
This script is an enhancement of the original RSI (Relative Strength Index) indicator for TradingView. While the core RSI functionality remains intact, several powerful features have been added to make it a better RSI tool for traders and investors.Key Features:
1. Divergence Detection: The script now includes both Bullish and Hidden Divergence detection. Bullish Divergence helps identify potential trend reversals when the price makes lower lows, but the RSI makes higher lows. Conversely, Hidden Divergence highlights instances where the RSI and price move in opposite directions, signaling potential trend continuation or reversal.
2. Bollinger Band Breakout Highlight: Users have the option to select "Bollinger Bands" as the Moving Average (MA) type in the settings. When enabled, this feature highlights RSI-Bollinger Band breakouts. It's a valuable tool for traders looking to capitalize on RSI movements in conjunction with Bollinger Bands.
3. Customizable Settings: The script provides a range of customizable settings, allowing you to adjust parameters like RSI length, MA type, Bollinger Bands standard deviation, and more to suit your trading strategy.
4. Clear Visuals: The script offers clear visual cues, with colored backgrounds indicating RSI overbought and oversold levels, as well as extreme breakouts. Bullish and bearish divergence points are also marked with distinct crosses, making it easy to spot potential trading opportunities.
Whether you're a seasoned trader or just starting, the indicator empowers you with advanced tools to make more informed trading decisions. Use it to identify potential trend reversals, continuation patterns, and RSI-Bollinger Band breakouts in the market.
Phát hành các Ghi chú
- Inputs and Calculations have been copied from RSI by PineCoders- Bull and Bear labels added to the indicators made by PineCoders
- I created to displayed Hidden Divergences
- Script is better organized
Phát hành các Ghi chú
- Added RSI Candle Bars (You can enable RSI Line or RSI bars in the style settings)Phát hành các Ghi chú
Small UpdatePhát hành các Ghi chú
- Heikin Ashi Candles
- MA Cloud
- Additional Lines (40, 60)
- RSI Heatmap
Phát hành các Ghi chú
- Introducing Cyclic RSI. Main code by StockMarketCycles, TradingView Editors Pick. It is more responsive to market moves than the basic RSI. All features works with Cyclic RSI.
Mã nguồn mở
Theo đúng tinh thần TradingView, tác giả của tập lệnh này đã công bố nó dưới dạng mã nguồn mở, để các nhà giao dịch có thể xem xét và xác minh chức năng. Chúc mừng tác giả! Mặc dù bạn có thể sử dụng miễn phí, hãy nhớ rằng việc công bố lại mã phải tuân theo Nội quy.
Thông báo miễn trừ trách nhiệm
Thông tin và các ấn phẩm này không nhằm mục đích, và không cấu thành, lời khuyên hoặc khuyến nghị về tài chính, đầu tư, giao dịch hay các loại khác do TradingView cung cấp hoặc xác nhận. Đọc thêm tại Điều khoản Sử dụng.