On Chart Reverse RSI cyclic smoothed + Divergence
The On Chart Reverse cRSI is a visual representational spin of the cRSI or (RSI cyclic smoothed, by Lars von Theinen) you all know and love with the addition of two key features, that in conjunction can be used to greatly assist the end-user in their decision making for entry, exit and risk management.
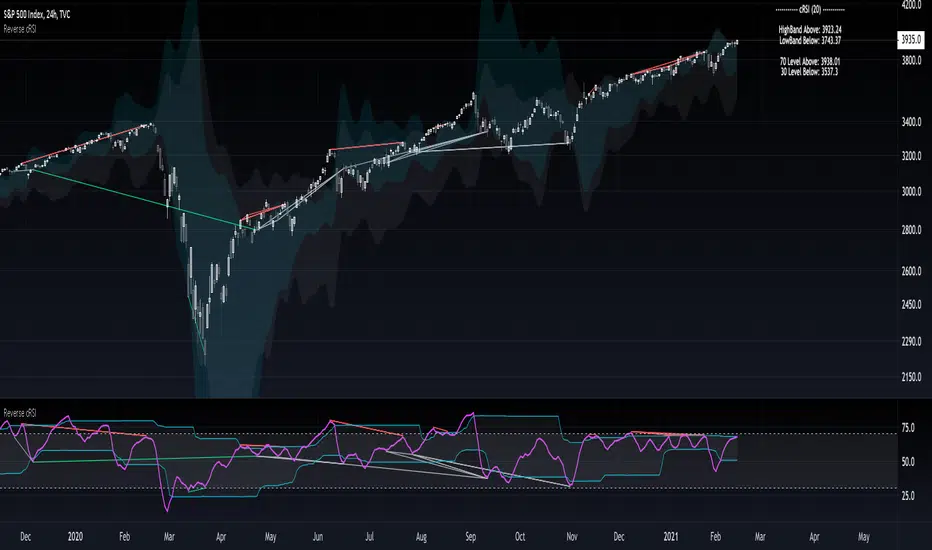
The first feature is the visual reverse engineered calculations of the HighBand, LowBand, as well as the user defined Upper and Lower Levels (70 & 30 by default), compared to the cRSI Level, in relation to the current price level as the point of divergence, which at a glance can then be used to visually see on the chart the closing price level needed in order to cross the cRSI either under or over the afore mentioned levels.
The second feature is the addition of my advanced On Chart divergence script in order to display regular as well as hidden divergences on the cRSI compared to the price level, in order to help the end-user train their eyes to spot them more accurately.
Divergence colors and description:
-------------------------------------
Green : Regular Bullish Divergence
White : Hidden Bullish Divergence
Red : Regular Bearish Divergence
Orange : Hidden Bearish Divergence
Optional Settings Include:
-----------------------------
1.) Show/Hide Reverse Levels
2.) Change the Reverse Levels Text Size
3.) Change the Reverse Levels Text Color
4.) Change the Reverse Levels Text Left Margin
5.) Change the Reverse Levels Decimal value
6.) Show/Hide the Reverse Levels Currency
7.) Show/hide the cRSI Divergence lines
8.) Change the cRSI Divergence line offset
9.) Show/hide the cRSI Divergence arrows
10.) Change the Regular Bullish Divergence Color
11.) Change the Hidden Bullish Divergence Color
12.) Change the Regular Bearish Divergence Color
13.) Change the Hidden Bearish Divergence Color
14.) Change the cRSI Divergence lookback (No. of bars to lookback)
RSI cyclic smoothed (cRSI)
-----------------------------
The RSI cyclic smoothed (cRSI) indicator is developed by Lars von Theinen and is subject to the terms of the Mozilla Public License 2.0 at mozilla.org/MPL/2.0/ Copyright (C) 2017 CC BY, whentotrade / Lars von Thienen. For more details on the cRSI Indicator:
RSI cyclic smoothed v2

The RSI cyclic smoothed (cRSI) is an enhancement of the classic RSI , adding
1) additional smoothing according to the market vibration,
2) adaptive upper and lower bands according to the cyclic memory and
3) using the current dominant cycle length as input for the indicator.
It is much more responsive to market moves than the basic RSI . The indicator uses the dominant cycle as input to optimize signal, smoothing, and cyclic memory. To get more in-depth information on the cyclic-smoothed RSI indicator, please read Decoding The Hidden Market Rhythm - Part 1: Dynamic Cycles (2017), Chapter 4: "Fine-tuning technical indicators." You need to derive the dominant cycle as input parameter for the cycle length as described in chapter 4.
Please PM me to obtain access.
Tập lệnh chỉ hiển thị cho người được mời
Chỉ những người dùng được tác giả chấp thuận mới có thể truy cập tập lệnh này. Bạn sẽ cần yêu cầu và được cấp quyền sử dụng. Thông thường quyền này được cấp sau khi thanh toán. Để biết thêm chi tiết, làm theo hướng dẫn của tác giả bên dưới hoặc liên hệ trực tiếp với lynchs.
TradingView KHÔNG khuyến nghị bạn trả phí hoặc sử dụng một tập lệnh trừ khi bạn hoàn toàn tin tưởng vào tác giả và hiểu cách hoạt động của tập lệnh. Bạn cũng có thể tìm các lựa chọn miễn phí, mã nguồn mở trong các script cộng đồng của chúng tôi.
Hướng dẫn của tác giả
Thông báo miễn trừ trách nhiệm
Tập lệnh chỉ hiển thị cho người được mời
Chỉ những người dùng được tác giả chấp thuận mới có thể truy cập tập lệnh này. Bạn sẽ cần yêu cầu và được cấp quyền sử dụng. Thông thường quyền này được cấp sau khi thanh toán. Để biết thêm chi tiết, làm theo hướng dẫn của tác giả bên dưới hoặc liên hệ trực tiếp với lynchs.
TradingView KHÔNG khuyến nghị bạn trả phí hoặc sử dụng một tập lệnh trừ khi bạn hoàn toàn tin tưởng vào tác giả và hiểu cách hoạt động của tập lệnh. Bạn cũng có thể tìm các lựa chọn miễn phí, mã nguồn mở trong các script cộng đồng của chúng tôi.