OPEN-SOURCE SCRIPT
[PX] Exhaustion Level

Hello guys,
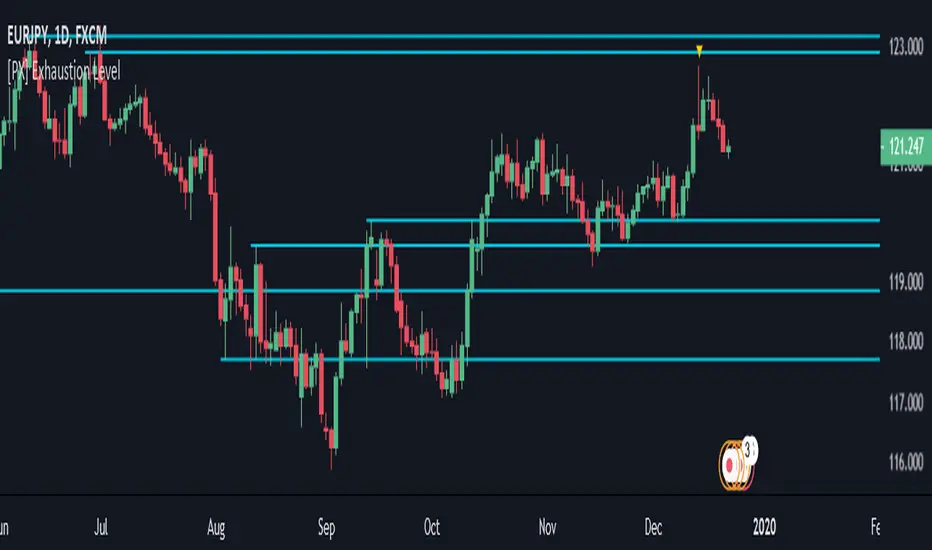
I love to play around with different methods for detecting support and resistance level. So today here is a new approach, which could be interesting to a few of you. I call it exhaustion level.
I'll give a brief introduction on how the indicator works and leave the testing/applying to you.
How does it work?
The method is basically very simple. The indicator constantly keeps track of the difference between the current close and the VWAP. The detected value will then be normalized and therefore put into comparison to it's previous "n" candles. (You decide yourself which value will be used for "n" by setting the "Length"-parameter in the settings tab.)
Once the normalized value equals "1", the price movement is considered to be somewhat overheated and the indicator starts plotting a level at the current high. The level will continually change until the movement goes the opposite way. Then it will settle and change its color.
The same approach takes place when the normalized value reaches "0", this time plotting a level at the low.
I hope some of you will find it useful and if so, please leave a "like" :)
Have fun, happy trading and merry Christmas :)))
Mã nguồn mở
Theo đúng tinh thần TradingView, tác giả của tập lệnh này đã công bố nó dưới dạng mã nguồn mở, để các nhà giao dịch có thể xem xét và xác minh chức năng. Chúc mừng tác giả! Mặc dù bạn có thể sử dụng miễn phí, hãy nhớ rằng việc công bố lại mã phải tuân theo Nội quy.
🙋♂️Listed as "Trusted Pine Programmer for Hire"
💰Save $30 on your Tradingview subscription: bit.ly/3OtLyNz
🔓Indicator access: dize-trading.de/
🔒Trial access: discord.gg/DqwKjBZ8Qe
💰Save $30 on your Tradingview subscription: bit.ly/3OtLyNz
🔓Indicator access: dize-trading.de/
🔒Trial access: discord.gg/DqwKjBZ8Qe
Thông báo miễn trừ trách nhiệm
Thông tin và các ấn phẩm này không nhằm mục đích, và không cấu thành, lời khuyên hoặc khuyến nghị về tài chính, đầu tư, giao dịch hay các loại khác do TradingView cung cấp hoặc xác nhận. Đọc thêm tại Điều khoản Sử dụng.