OPEN-SOURCE SCRIPT
Cập nhật MegaChange
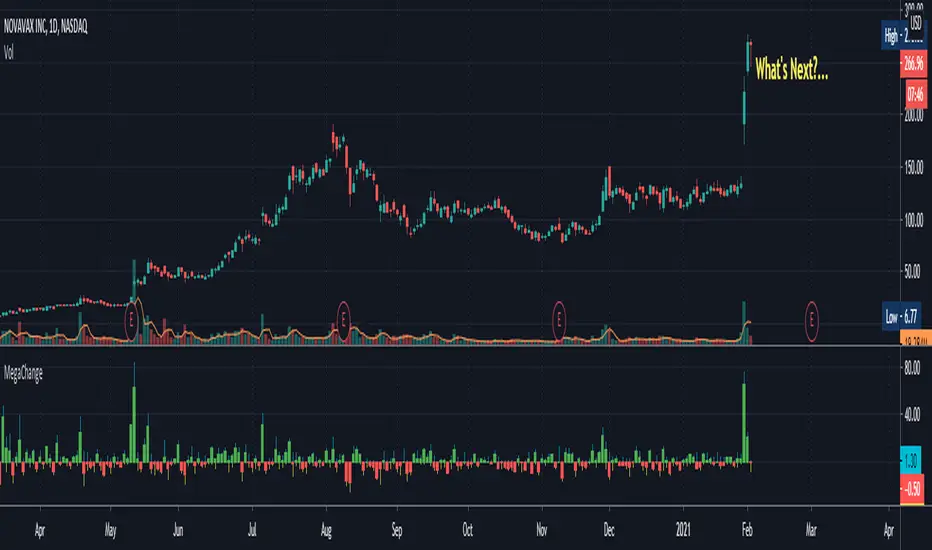
The MegaChange indicator is a traditional Change - on steroids!
This indicator visualizes the Change from the current bar to the one before.
Besides showing the standard change (% change from the previous bar's Last to current bar's Last),
the indicator also includes the % change from the previous bar's Last
to current bar's High, and to current bar's Low.
The result is always in percentage.
"green" days and "red" days are separated so you can always see on the scales the change for
the last green day and the change for the last red day (only one of whom is the current change).
The indicator demonstrates "how far" the change has gone each way, and where is it currently.
Here's an example, using the chart above:
When we look at the big red candle we might see it as a very bad sign. (With the blue bubble next to it)
When we examine that candle with this indicator - the MegaChange - we can observe that the downside
is very small in comparison to the Upside that came before that. (Tagged as 1)
On the next candle (Tagged as 2) we can see a small tail representing the stock price going down
and coming most of the way back. returning from -16% to only -4% after moving more than +170% only 2 days earlier!
This might mean that the buyers are coming back and they're chasing the stock again for another run (long).
This is an example of how the indicator might indicate future moves, when we might think the move is already over.
Looking at the chart alone might be frightening, but using the indicator makes a change, as we can see that's the downside
was really small relative to the upside. The small tail from the last day might tell us that the buyers are coming back,
and that the stock might still have a potential Upside.
fill free to ask any questions, or tell me if you find this indicator helpful, and how.
Phát hành các Ghi chú
No dramatic changes. I solved the issue of presenting both values when one of them is unnecessary, so now only the true value of the close is being presented.
I changed the default color for the low to Yellow for better visibility.
Hope you enjoy the indicator and get the most out of it. Good luck.
Phát hành các Ghi chú
new example (chart).Mã nguồn mở
Theo đúng tinh thần TradingView, tác giả của tập lệnh này đã công bố nó dưới dạng mã nguồn mở, để các nhà giao dịch có thể xem xét và xác minh chức năng. Chúc mừng tác giả! Mặc dù bạn có thể sử dụng miễn phí, hãy nhớ rằng việc công bố lại mã phải tuân theo Nội quy.
Thông báo miễn trừ trách nhiệm
Thông tin và các ấn phẩm này không nhằm mục đích, và không cấu thành, lời khuyên hoặc khuyến nghị về tài chính, đầu tư, giao dịch hay các loại khác do TradingView cung cấp hoặc xác nhận. Đọc thêm tại Điều khoản Sử dụng.
Mã nguồn mở
Theo đúng tinh thần TradingView, tác giả của tập lệnh này đã công bố nó dưới dạng mã nguồn mở, để các nhà giao dịch có thể xem xét và xác minh chức năng. Chúc mừng tác giả! Mặc dù bạn có thể sử dụng miễn phí, hãy nhớ rằng việc công bố lại mã phải tuân theo Nội quy.
Thông báo miễn trừ trách nhiệm
Thông tin và các ấn phẩm này không nhằm mục đích, và không cấu thành, lời khuyên hoặc khuyến nghị về tài chính, đầu tư, giao dịch hay các loại khác do TradingView cung cấp hoặc xác nhận. Đọc thêm tại Điều khoản Sử dụng.