OPEN-SOURCE SCRIPT
Cập nhật Cheat Code
Why Monday & Friday
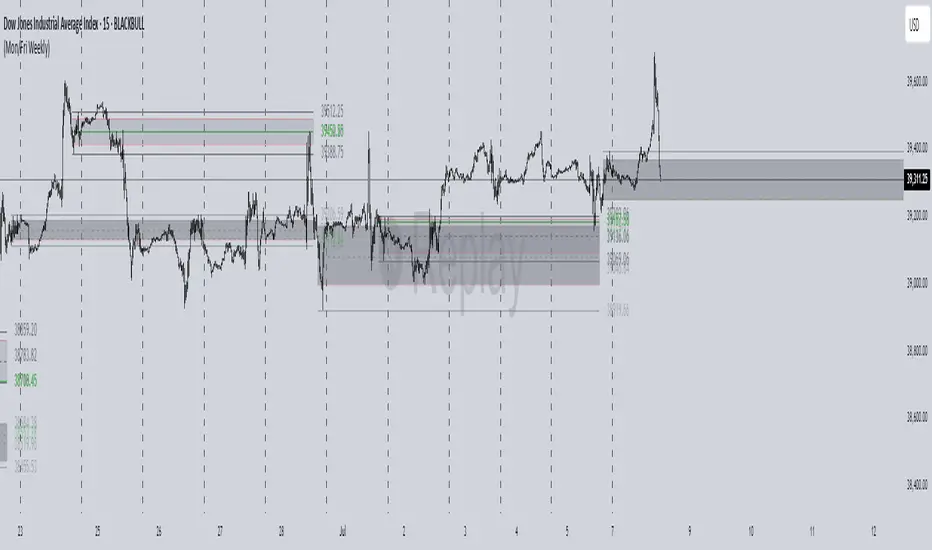
Monday evening (NY): frequently seeds the weekly expansion. Its DR/IDR often acts as a weekly “starter envelope,” useful for breakout continuation or fade back into the box plays as liquidity builds.
Friday evening (NY): often exposes end-of-week traps (run on stops into the close) and sets expectation boundaries into the following week. Carry these levels forward to catch Monday’s reaction to Friday’s closing structure.
Typical use-cases
Breakout & retest:
Price closes outside the Monday DR/IDR → look for retests of the band edge for continuation.
Liquidity sweep (“trap”) recognition:
Friday session wicks briefly beyond Friday DR/IDR then closes back inside → watch for mean reversion early next week.
Bias filter:
Above both Monday DR midline and Friday DR midline → bias long until proven otherwise; the inverse for shorts.
Session open confluence:
Reactions at the open line frequently mark decision points for momentum vs. fade setups.
(This is a levels framework, not a signals engine. Combine with your execution model: orderflow, S/R, session timing, or higher-TF bias.)
Inputs & styling (quick reference)
Display toggles (per day):
Show DR / IDR / Middle DR / Middle IDR
Show Opening Line
Show DR/IDR Box (choose DR or IDR as box source)
Show Price Labels
Style controls (per day):
Line width (1–4), style (Solid/Dashed/Dotted)
Independent colors for DR, IDR, midlines, open line
Box background opacity
Timezone:
Default America/New_York (changeable).
Optional on-chart warning if your chart TZ differs.
Practical notes
Works on intraday charts; levels are anchored using weekly timestamps for accuracy on any symbol.
Live updating: During the Mon/Fri calc windows, DR/IDR highs/lows and midlines keep updating until the session ends.
Clean drawings: Lines, box, and labels are created once per session and then extended/updated—efficient on resources even with long display windows.
Max elements: Script reserves ample line/box/label capacity for stability across weeks.
Phát hành các Ghi chú
1. Sessions it tracksThis script is only about Monday evening and Friday evening trading sessions in America/New_York time:
Monday session: from 19:30 → 23:00 (NY time)
Friday session: from 19:30 → 23:00 (NY time)
It does not track the rest of the week.
2. What it measures inside each session
For each session, it calculates two ranges:
DR (Daily Range):
The session’s highest high and lowest low between 19:30–23:00.
IDR (Initial / Inside Range):
The range between the max(open, close) and min(open, close) of all the candles inside that session (basically the body extremes, ignoring wicks).
It also records:
The middle of the DR (avg(high, low)).
The middle of the IDR (avg(max(open,close), min(open,close))).
The opening price of the session (first bar at 19:30).
3. Drawing logic
It plots these ranges on your chart:
Box:
Draws a shaded box covering either the DR or IDR (your choice), extending beyond the session:
Monday’s box extends until Friday 18:00 of the same week.
Friday’s box extends until next Friday 18:00.
Lines:
Horizontal lines at:
DR high & low (and optional middle).
IDR high & low (and optional middle).
Session open price.
All lines extend until the end of the extension window.
Labels:
Price labels at the right edge of each line, if enabled.
Styles:
You can toggle each feature on/off (box, DR lines, IDR lines, midlines, open line, labels).
You can also choose colors, line styles (solid/dashed/dotted), and widths separately for Monday and Friday.
Mã nguồn mở
Theo đúng tinh thần TradingView, tác giả của tập lệnh này đã công bố nó dưới dạng mã nguồn mở, để các nhà giao dịch có thể xem xét và xác minh chức năng. Chúc mừng tác giả! Mặc dù bạn có thể sử dụng miễn phí, hãy nhớ rằng việc công bố lại mã phải tuân theo Nội quy.
Thông báo miễn trừ trách nhiệm
Thông tin và các ấn phẩm này không nhằm mục đích, và không cấu thành, lời khuyên hoặc khuyến nghị về tài chính, đầu tư, giao dịch hay các loại khác do TradingView cung cấp hoặc xác nhận. Đọc thêm tại Điều khoản Sử dụng.