[PATAlgo] Index Options (v2)
This advanced indicator is engineered to empower traders with real-time insights into market trends and price dynamics. Through sophisticated algorithms and cutting-edge functionalities, it provides a competitive edge, enabling users to stay ahead of market curves and make well-informed trading decisions.
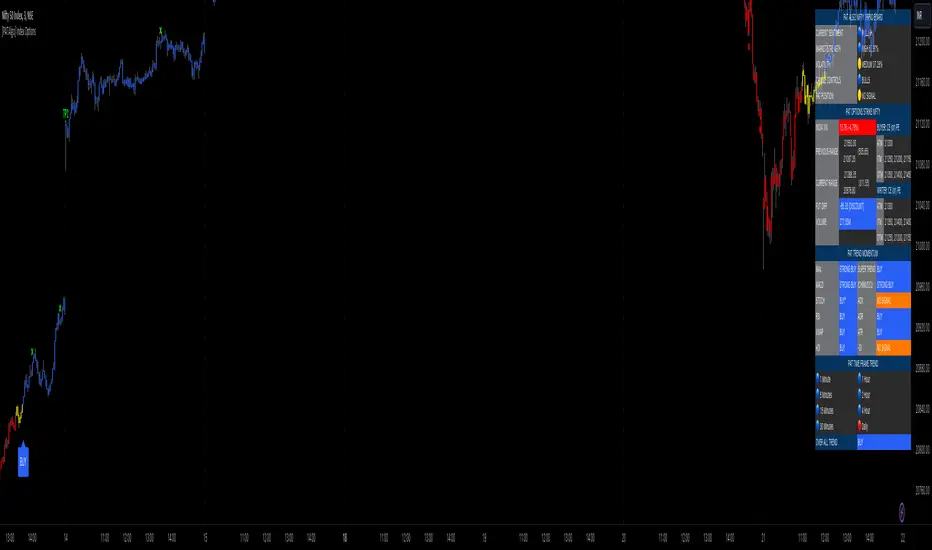
One of the standout features of PATAlgo Index Options is its chart and candle analysis setup, facilitating pattern identification and aiding traders in making prudent decisions. Below, we delve into the core features of this indicator suite, offering a detailed explanation of its functionalities.
1. PAT Signals:
Signal Mode: Tailored to trader styles, accommodating scalpers, swing traders, and positional traders.
Signal Reactivity: Allows customization for signal frequency, with settings ranging from 1.2 to 6.
Signal Strength: Defines signal intensity on a scale from 1 to 10.
2. PAT Trace:
A trend-tracing tool effective across all time frames, particularly beneficial for scalpers and swing traders.
Analyzes historical price data to identify patterns, support/resistance levels, and trend lines.
3. PAT Trends:
An auto-trending indicator based on price action and patterns, offering clarity on market trends and breakouts.
4. PAT Profile:
A powerful volume analysis tool aiding in technical analysis.
Analyzes traded volume at different price levels, identifying support and resistance, tracking market sentiment, and informing trading decisions.
5. PAT S/R:
Auto support and resistance analysis tool, eliminating the need for manual analysis.
Provides traders with key levels for making informed trading decisions.
6. PAT Auto FIB:
Automatically plots Fibonacci retracement levels on a price chart.
Simplifies the identification of potential support and resistance areas based on Fibonacci ratios.
7. PAT Blocks:
Represents significant buying or selling activity on a particular price level.
Identifies price rejections or consolidations, indicating potential imbalances between supply and demand.
8. PAT Zone:
Identifies key support and resistance zones on a price chart.
Indicates areas where buying and selling pressure is concentrated based on historical price action.
Tập lệnh chỉ hiển thị cho người được mời
Chỉ những người dùng được tác giả chấp thuận mới có thể truy cập tập lệnh này. Bạn sẽ cần yêu cầu và được cấp quyền sử dụng. Thông thường quyền này được cấp sau khi thanh toán. Để biết thêm chi tiết, làm theo hướng dẫn của tác giả bên dưới hoặc liên hệ trực tiếp với PAT_CLUB.
Lưu ý rằng tập lệnh riêng tư này, chỉ dành cho người được mời, chưa được các quản trị viên tập lệnh xem xét, và việc tuân thủ Nội quy vẫn chưa được xác định. TradingView KHÔNG khuyến nghị bạn trả phí hoặc sử dụng một tập lệnh trừ khi bạn hoàn toàn tin tưởng vào tác giả và hiểu cách hoạt động của tập lệnh. Bạn cũng có thể tìm các lựa chọn miễn phí, mã nguồn mở trong các script cộng đồng của chúng tôi.
Hướng dẫn của tác giả
Thông báo miễn trừ trách nhiệm
Tập lệnh chỉ hiển thị cho người được mời
Chỉ những người dùng được tác giả chấp thuận mới có thể truy cập tập lệnh này. Bạn sẽ cần yêu cầu và được cấp quyền sử dụng. Thông thường quyền này được cấp sau khi thanh toán. Để biết thêm chi tiết, làm theo hướng dẫn của tác giả bên dưới hoặc liên hệ trực tiếp với PAT_CLUB.
Lưu ý rằng tập lệnh riêng tư này, chỉ dành cho người được mời, chưa được các quản trị viên tập lệnh xem xét, và việc tuân thủ Nội quy vẫn chưa được xác định. TradingView KHÔNG khuyến nghị bạn trả phí hoặc sử dụng một tập lệnh trừ khi bạn hoàn toàn tin tưởng vào tác giả và hiểu cách hoạt động của tập lệnh. Bạn cũng có thể tìm các lựa chọn miễn phí, mã nguồn mở trong các script cộng đồng của chúng tôi.