OPEN-SOURCE SCRIPT
BollingerBands MTF | AlchimistOfCrypto
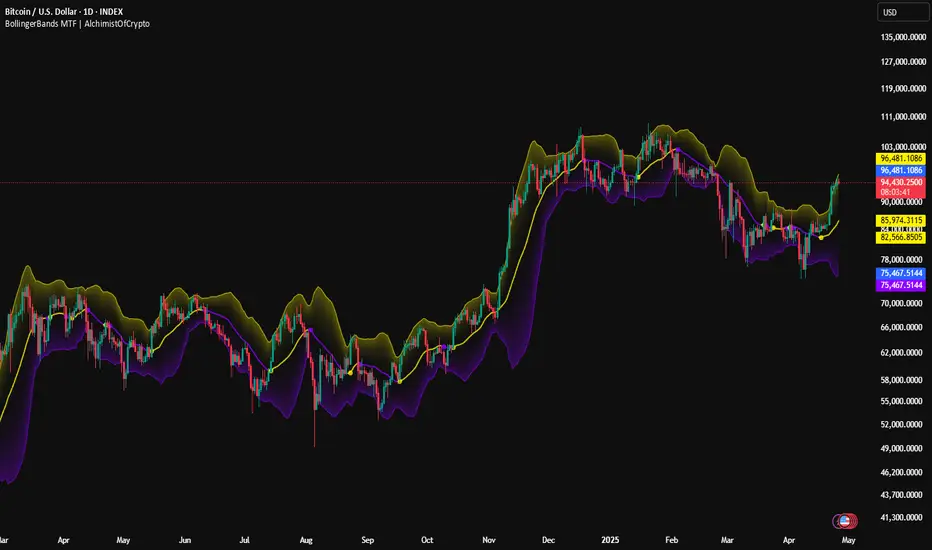
🌌 Bollinger Bands [AlchimistOfCrypto] – Unveiling Market Volatility Fields 🌌
"The Bollinger Bands, reimagined through quantum mechanics principles, visualizes the probabilistic distribution of price movements within a multi-dimensional volatility field. This indicator employs principles from wave function mathematics where standard deviation creates probabilistic boundaries, similar to electron cloud models in quantum physics. Our implementation features algorithmically enhanced visualization derived from extensive mathematical modeling, creating a dynamic representation of volatility compression and expansion cycles with adaptive glow effects that highlight the critical moments where volatility phase transitions occur."
📊 Professional Trading Application
The Bollinger Bands Quantum [AlchimistOfCrypto] transcends traditional volatility measurement with a sophisticated gradient illumination system that reveals the underlying structure of market volatility fields. Scientifically calibrated for multiple timeframes and featuring eight distinct visual themes, it enables traders to perceive volatility contractions and expansions with unprecedented clarity.
⚙️ Indicator Configuration
- Volatility Field Parameters 📏
Python-optimized settings for specific market conditions:
- Period: 20 (default) - The quantum time window for volatility calculation
- StdDev Multiplier: 2.0 - The probabilistic boundary coefficient
- MA Type: SMA/EMA/VWMA/WMA/RMA - The quantum field smoothing algorithm
- Visual Theming 🎨
Eight scientifically designed visual palettes optimized for volatility pattern recognition:
- Neon (default): High-contrast green/red scheme enhancing volatility transition visibility
- Cyan-Magenta: Vibrant palette for maximum volatility boundary distinction
- Yellow-Purple: Complementary colors for enhanced compression/expansion detection
- Specialized themes (Green-Red, Forest Green, Blue Ocean, Orange-Red, Grayscale): Each calibrated for different market environments
- Opacity Control 🔍
- Variable transparency system (0-100) allowing seamless integration with price action
- Adaptive glow effect that intensifies during volatility phase transitions
- Quantum field visualization that reveals the probabilistic nature of price movements
🚀 How to Use
1. Select Visualization Parameters ⏰: Adjust period and standard deviation to match market conditions
2. Choose MA Type 🎚️: Select the appropriate smoothing algorithm for your trading strategy
3. Select Visual Theme 🌈: Choose a color scheme that enhances your personal pattern recognition
4. Adjust Opacity 🔎: Fine-tune visualization intensity to complement your chart analysis
5. Identify Volatility Phases ✅: Monitor band width to detect compression (pre-breakout) and expansion (trend)
6. Trade with Precision 🛡️: Enter during band contraction for breakouts, or trade mean reversion using band boundaries
7. Manage Risk Dynamically 🔐: Use band width as volatility-based position sizing parameter
Mã nguồn mở
Theo đúng tinh thần TradingView, tác giả của tập lệnh này đã công bố nó dưới dạng mã nguồn mở, để các nhà giao dịch có thể xem xét và xác minh chức năng. Chúc mừng tác giả! Mặc dù bạn có thể sử dụng miễn phí, hãy nhớ rằng việc công bố lại mã phải tuân theo Nội quy.
A lot of gifts with my links! 🎁
(Support me!)
(Support me!)
Thông báo miễn trừ trách nhiệm
Thông tin và các ấn phẩm này không nhằm mục đích, và không cấu thành, lời khuyên hoặc khuyến nghị về tài chính, đầu tư, giao dịch hay các loại khác do TradingView cung cấp hoặc xác nhận. Đọc thêm tại Điều khoản Sử dụng.