OPEN-SOURCE SCRIPT
Cập nhật Gamma + Fibonacci EMA Bands
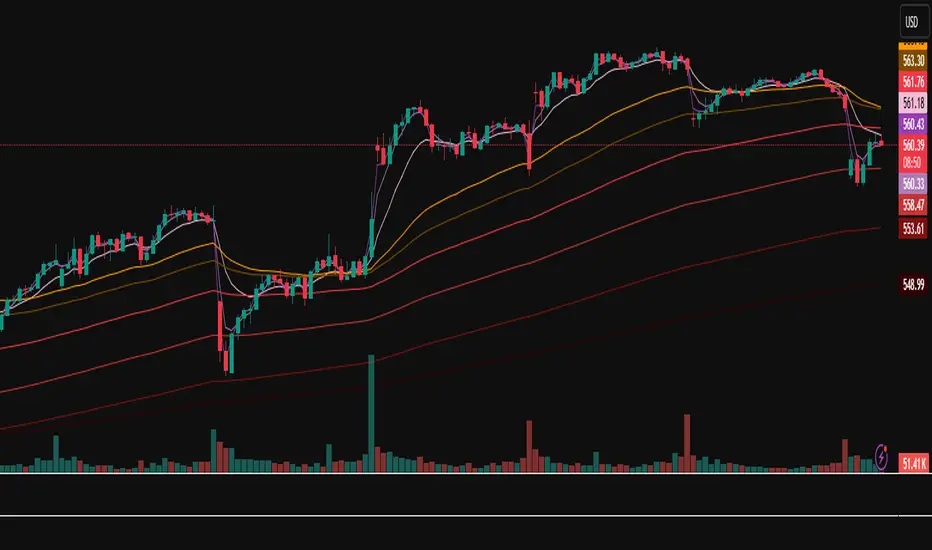
# Gamma + Fibonacci EMA Bands
## Overview
The Gamma + Fibonacci EMA Bands indicator combines two powerful analytical approaches: Gamma-weighted Exponential Moving Averages and Fibonacci sequence-based standard EMAs. This dual system creates a comprehensive "band" structure that helps identify trend direction, strength, and potential reversal zones with greater precision than single moving average systems.
## Features
- **Gamma-weighted EMAs**: Three customizable Gamma EMAs (fast-responding) with adjustable gamma parameters
- **Fibonacci Sequence EMAs**: Six standard EMAs based on the Fibonacci sequence (34, 55, 89, 144, 233, 377)
- **Visual Band Structure**: Color-coded for instant visual analysis
- **Trend Confirmation**: Multiple timeframe validation through varied moving average periods
- **Support/Resistance Identification**: Natural price reaction zones highlighted by EMA confluences
## How It Works
The indicator uses two complementary EMA systems:
1. **Gamma EMAs** (γ-EMAs) - These responsive moving averages use a direct gamma weighting factor (between 0-1) rather than a period length. Lower gamma values create smoother lines, while higher values create more responsive ones. These react quickly to price changes and serve as short-term trend indicators.
2. **Fibonacci EMAs** - These traditional EMAs use period lengths based on the Fibonacci sequence (34, 55, 89, 144, 233, 377). They provide longer-term trend context and naturally identify key support/resistance levels that align with market psychology.
## Interpretation
### Trend Direction
- When price is above all bands: Strong bullish trend
- When price is below all bands: Strong bearish trend
- When price is between bands: Consolidation or trend transition
### Support/Resistance
- Gamma EMAs (purple shades): Short-term dynamic support/resistance
- Fibonacci EMAs (orange/red shades): Stronger, longer-term support/resistance
### Trend Strength
- Wider band separation: Stronger trend momentum
- Compressed bands: Consolidation or trend weakness
### Reversal Signals
- Price breaking through multiple bands: Potential trend reversal
- Gamma EMAs crossing Fibonacci EMAs: Changing momentum
## Settings
- **Source**: Price data source (default: close)
- **Gamma 1**: Fast γ-EMA value (default: 0.2)
- **Gamma 2**: Medium γ-EMA value (default: 0.5)
- **Gamma 3**: Slow γ-EMA value (default: 0.8)
## Notes
This indicator works best on higher timeframes (1H+) and liquid markets. The Gamma-weighted EMAs provide faster signals while the Fibonacci sequence EMAs provide reliable support/resistance levels that often align with key market turning points.
For optimal use, watch for price interaction with these bands and how the bands interact with each other to confirm trend changes before they become obvious to the majority of market participants.
Phát hành các Ghi chú
# Gamma + Fibonacci EMA Bands## Overview
The Gamma + Fibonacci EMA Bands indicator combines two powerful analytical approaches: Gamma-weighted Exponential Moving Averages and Fibonacci sequence-based standard EMAs. This dual system creates a comprehensive "band" structure that helps identify trend direction, strength, and potential reversal zones with greater precision than single moving average systems.
## Features
- **Gamma-weighted EMAs**: Three customizable Gamma EMAs (fast-responding) with adjustable gamma parameters
- **Fibonacci Sequence EMAs**: Six standard EMAs based on the Fibonacci sequence (34, 55, 89, 144, 233, 377)
- **Visual Band Structure**: Color-coded for instant visual analysis
- **Trend Confirmation**: Multiple timeframe validation through varied moving average periods
- **Support/Resistance Identification**: Natural price reaction zones highlighted by EMA confluences
## How It Works
The indicator uses two complementary EMA systems:
1. **Gamma EMAs** (γ-EMAs) - These responsive moving averages use a direct gamma weighting factor (between 0-1) rather than a period length. Lower gamma values create smoother lines, while higher values create more responsive ones. These react quickly to price changes and serve as short-term trend indicators.
2. **Fibonacci EMAs** - These traditional EMAs use period lengths based on the Fibonacci sequence (34, 55, 89, 144, 233, 377). They provide longer-term trend context and naturally identify key support/resistance levels that align with market psychology.
## Interpretation
### Trend Direction
- When price is above all bands: Strong bullish trend
- When price is below all bands: Strong bearish trend
- When price is between bands: Consolidation or trend transition
### Support/Resistance
- Gamma EMAs (purple shades): Short-term dynamic support/resistance
- Fibonacci EMAs (orange/red shades): Stronger, longer-term support/resistance
### Trend Strength
- Wider band separation: Stronger trend momentum
- Compressed bands: Consolidation or trend weakness
### Reversal Signals
- Price breaking through multiple bands: Potential trend reversal
- Gamma EMAs crossing Fibonacci EMAs: Changing momentum
## Settings
- **Source**: Price data source (default: close)
- **Gamma 1**: Fast γ-EMA value (default: 0.2)
- **Gamma 2**: Medium γ-EMA value (default: 0.5)
- **Gamma 3**: Slow γ-EMA value (default: 0.8)
## Notes
This indicator works best on higher timeframes (1H+) and liquid markets. The Gamma-weighted EMAs provide faster signals while the Fibonacci sequence EMAs provide reliable support/resistance levels that often align with key market turning points.
For optimal use, watch for price interaction with these bands and how the bands interact with each other to confirm trend changes before they become obvious to the majority of market participants.
Mã nguồn mở
Theo đúng tinh thần TradingView, tác giả của tập lệnh này đã công bố nó dưới dạng mã nguồn mở, để các nhà giao dịch có thể xem xét và xác minh chức năng. Chúc mừng tác giả! Mặc dù bạn có thể sử dụng miễn phí, hãy nhớ rằng việc công bố lại mã phải tuân theo Nội quy.
Thông báo miễn trừ trách nhiệm
Thông tin và các ấn phẩm này không nhằm mục đích, và không cấu thành, lời khuyên hoặc khuyến nghị về tài chính, đầu tư, giao dịch hay các loại khác do TradingView cung cấp hoặc xác nhận. Đọc thêm tại Điều khoản Sử dụng.