OPEN-SOURCE SCRIPT
Auto Fibonacci Lines
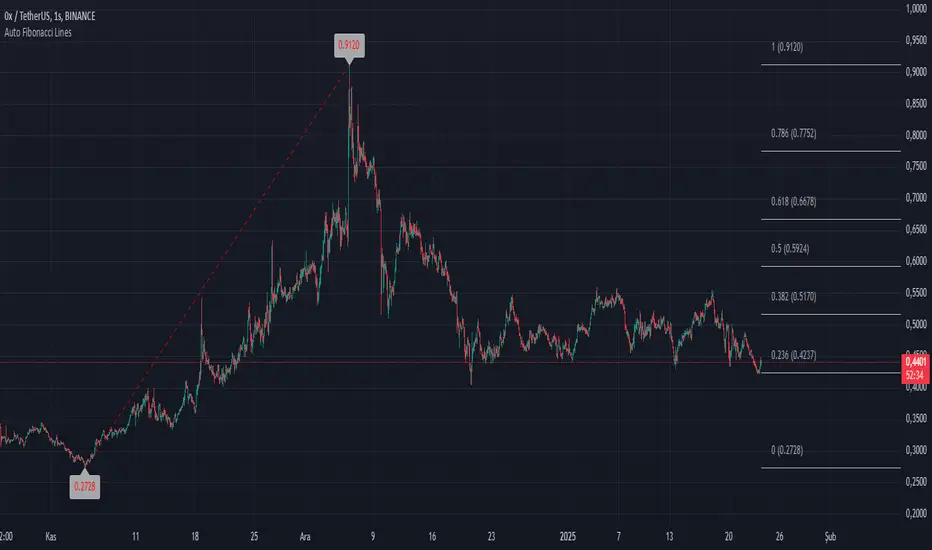
This TradingView script is a modded version of the library called "VisibleChart" created by Pinecoder.
This version has the option for users to change the Fibonacci lines and price labels. This makes the script user-friendly.
Fibonacci extensions are a tool that traders can use to establish profit targets or estimate how far a price may travel after a retracement/pullback is finished. Extension levels are also possible areas where the price may reverse. This study automatically draws horizontal lines that are used to determine possible support and resistance levels.
It's designed to automatically plot Fibonacci retracement levels on chart, aiding in technical analysis for traders.
First, the highest and lowest bars on the chart are calculated. These values are used for Fibonacci extensions.
These values update as traders scroll or zoom their charts, this shows that it is a useful indicator that can dynamically calculate and draw visuals on visible bars only.
Mã nguồn mở
Theo đúng tinh thần TradingView, tác giả của tập lệnh này đã công bố nó dưới dạng mã nguồn mở, để các nhà giao dịch có thể xem xét và xác minh chức năng. Chúc mừng tác giả! Mặc dù bạn có thể sử dụng miễn phí, hãy nhớ rằng việc công bố lại mã phải tuân theo Nội quy.
Thông báo miễn trừ trách nhiệm
Thông tin và các ấn phẩm này không nhằm mục đích, và không cấu thành, lời khuyên hoặc khuyến nghị về tài chính, đầu tư, giao dịch hay các loại khác do TradingView cung cấp hoặc xác nhận. Đọc thêm tại Điều khoản Sử dụng.