OPEN-SOURCE SCRIPT
Lunar Sentiment Bands
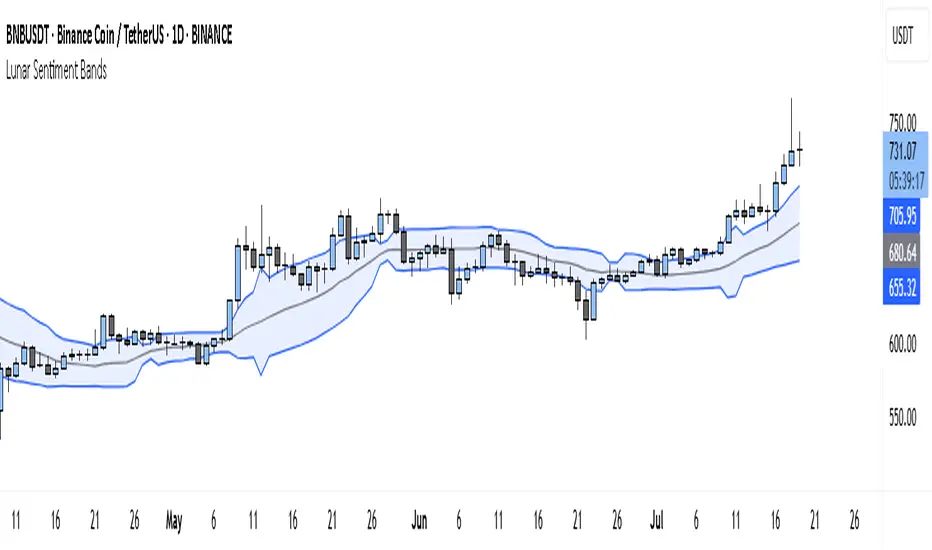
The Lunar Sentiment Bands indicator is designed to combine simple price volatility analysis with the timing of moon phases. It's based on a moving average and two bands above and below it—similar to Bollinger Bands. But unlike regular bands, the width of these adjusts dynamically depending on two key conditions: the moon phase and market volume.
Around Full Moons, markets often show emotional or volatile behavior. If there's also a surge in trading volume during that time, the indicator automatically expands the bands. This tells you the market might be gearing up for a breakout or high-energy move.
Around New Moons, things are typically quieter. If there’s no significant volume, the indicator contracts the bands. This reflects a calmer environment or a potential “coil” where price is building up energy.
Traders can use this shifting bandwidth to guide decisions. Wide bands suggest breakout potential—either to join the move or to stand back until direction becomes clearer. Narrow bands suggest you may want to trade reversals, or simply wait for volatility to return before entering a position.
This approach doesn't try to predict direction. Instead, it gives you a sense of when the market is most likely to become active or stay quiet, using the rhythm of the moon and real-time volume to shape that view.
Mã nguồn mở
Theo đúng tinh thần TradingView, tác giả của tập lệnh này đã công bố nó dưới dạng mã nguồn mở, để các nhà giao dịch có thể xem xét và xác minh chức năng. Chúc mừng tác giả! Mặc dù bạn có thể sử dụng miễn phí, hãy nhớ rằng việc công bố lại mã phải tuân theo Nội quy.
Trade forex, indices, stocks and metals with up to US$100.000 in company's funding.
Complete a challenge to access funding or go for instant deposit.
Trading involves substantial risk. Not financial advice
Complete a challenge to access funding or go for instant deposit.
Trading involves substantial risk. Not financial advice
Thông báo miễn trừ trách nhiệm
Thông tin và các ấn phẩm này không nhằm mục đích, và không cấu thành, lời khuyên hoặc khuyến nghị về tài chính, đầu tư, giao dịch hay các loại khác do TradingView cung cấp hoặc xác nhận. Đọc thêm tại Điều khoản Sử dụng.