OPEN-SOURCE SCRIPT
Cập nhật Blockunity Drawdown Visualizer (BDV)
Monitor the drawdown (value of the drop between the highest and lowest points) of assets and act accordingly to reduce your risk.
Introducing BDV, the incredibly intuitive metric that visualizes asset drawdowns in the most visually appealing manner. With its color gradient display, BDV allows you to instantly grasp the state of retracement from the asset’s highest price level. But that’s not all – you have the option to display the oscillator’s colorization directly on your chart, enhancing your analysis even further.
The Idea
The goal is to provide the community with the best and most complete tool for visualizing the Drawdown of any asset.
How to Use
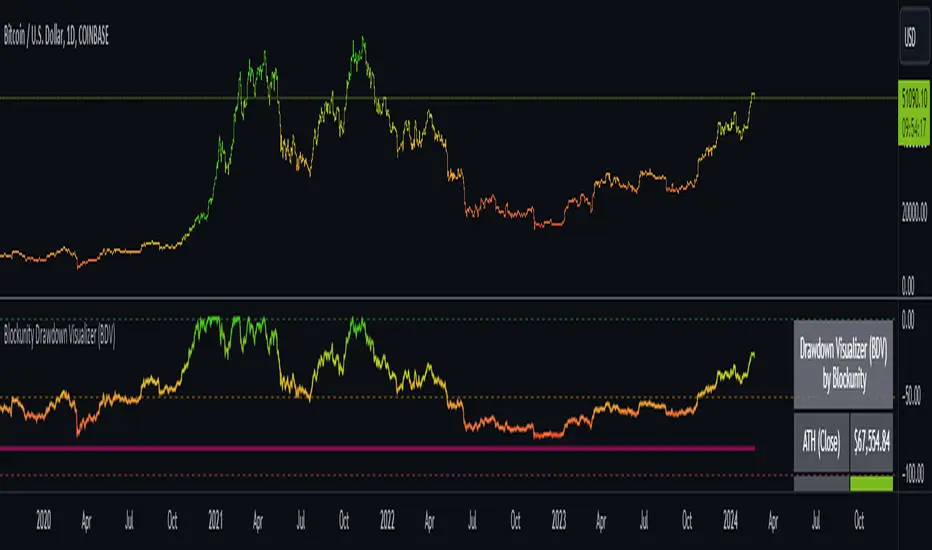
Very simple to use, the indicator takes the form of an oscillator, with colors ranging from red to green depending on the Drawdown level. A table summarizes several key data points.
Elements
On the oscillator, you'll find a line with a color gradient showing the asset's Drawdown. The flatter line represents the Max Drawdown (the lowest value reached).
In addition, the table summarizes several data:
Settings
First of all, you can activate a "Bar Color" in the settings (You must also uncheck "Borders" and "Wick" in your Chart Settings):

You can display Fibonacci levels on the oscillator. You'll see that levels can be relevant to drawdown. The color of the levels is also configurable.

In the calculation parameters, you can first choose between taking the High of the candles or the Close. By default this is Close, but if you change the parameter to High, the indication next to ATH in the table will change, and you'll see that the values in the table will be affected.

The second calculation parameter (Start Date) lets you modify the effective start date of the ATH, which will affect the drawdown level. Here's an example:

How it Works
First, we calculate the ATH:
Pine Script®
Then the drawdown is calculated as follows:
Pine Script®
Then the max drawdown :
Pine Script®
Introducing BDV, the incredibly intuitive metric that visualizes asset drawdowns in the most visually appealing manner. With its color gradient display, BDV allows you to instantly grasp the state of retracement from the asset’s highest price level. But that’s not all – you have the option to display the oscillator’s colorization directly on your chart, enhancing your analysis even further.
The Idea
The goal is to provide the community with the best and most complete tool for visualizing the Drawdown of any asset.
How to Use
Very simple to use, the indicator takes the form of an oscillator, with colors ranging from red to green depending on the Drawdown level. A table summarizes several key data points.
Elements
On the oscillator, you'll find a line with a color gradient showing the asset's Drawdown. The flatter line represents the Max Drawdown (the lowest value reached).
In addition, the table summarizes several data:
- The asset's All Time High (ATH).
- Current Drawdown.
- The Max Drawdown that has been reached.
Settings
First of all, you can activate a "Bar Color" in the settings (You must also uncheck "Borders" and "Wick" in your Chart Settings):
You can display Fibonacci levels on the oscillator. You'll see that levels can be relevant to drawdown. The color of the levels is also configurable.
In the calculation parameters, you can first choose between taking the High of the candles or the Close. By default this is Close, but if you change the parameter to High, the indication next to ATH in the table will change, and you'll see that the values in the table will be affected.
The second calculation parameter (Start Date) lets you modify the effective start date of the ATH, which will affect the drawdown level. Here's an example:
How it Works
First, we calculate the ATH:
var bdv_top = bdv_source
bdv_top := na(bdv_top[1]) ? bdv_source : math.max(bdv_source, bdv_top[1])
Then the drawdown is calculated as follows:
bdv = ((bdv_source / bdv_top) * 100) - 100
Then the max drawdown :
bdv_max = bdv
bdv_max := na(bdv_max[1]) ? bdv : math.min(bdv, bdv_max[1])
Phát hành các Ghi chú
Addition of an alerting system. This alert can be activated by setting the condition "Blockunity Drawdown Visualizer (BDV)" and selecting "Any alert() function call". The alerts sent are as follows:- New Max Drawdown.
- Drawdown falls below -25% / Drawdown recovers -25%.
- Drawdown falls below -50% / Drawdown recovers -50%.
- Drawdown falls below -75% / Drawdown recovers -75%.
Mã nguồn mở
Theo đúng tinh thần TradingView, tác giả của tập lệnh này đã công bố nó dưới dạng mã nguồn mở, để các nhà giao dịch có thể xem xét và xác minh chức năng. Chúc mừng tác giả! Mặc dù bạn có thể sử dụng miễn phí, hãy nhớ rằng việc công bố lại mã phải tuân theo Nội quy.
Blockunity
app.blockunity.io/
unyx-data.com/
contact@blockunity.io
app.blockunity.io/
unyx-data.com/
contact@blockunity.io
Thông báo miễn trừ trách nhiệm
Thông tin và các ấn phẩm này không nhằm mục đích, và không cấu thành, lời khuyên hoặc khuyến nghị về tài chính, đầu tư, giao dịch hay các loại khác do TradingView cung cấp hoặc xác nhận. Đọc thêm tại Điều khoản Sử dụng.