OPEN-SOURCE SCRIPT
RSI Ignoring Gaps Between Days
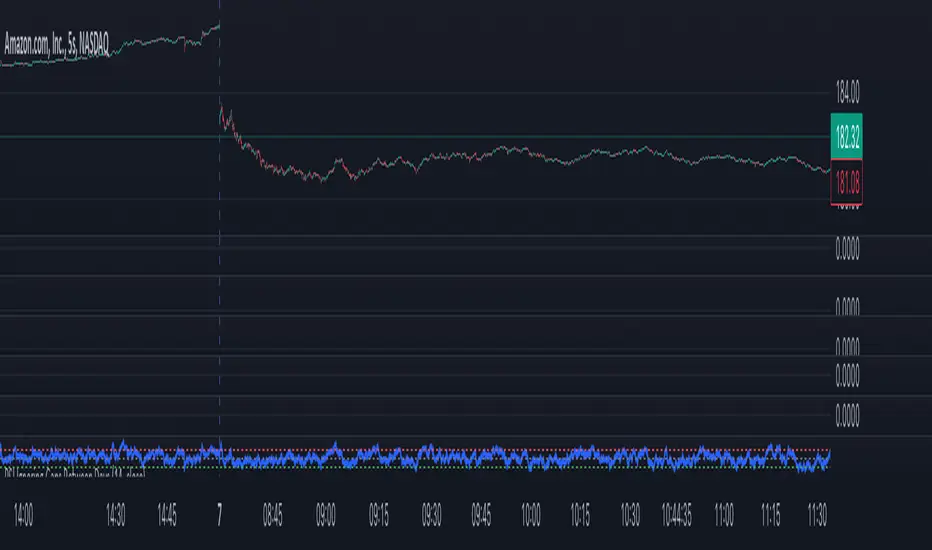
The RSI Ignoring Gaps Between Days indicator is an advanced modification of the traditional Relative Strength Index (RSI) designed to exclude price gaps that occur between the last bar of one trading day and the first bar of the next. This ensures that the RSI calculations remain focused on the actual price action during the trading session, avoiding distortions caused by overnight price gaps.
Key Features:
Gap Ignoring Mechanism: The indicator detects when a new day begins and skips the price change between the last bar of the previous day and the first bar of the current day. This ensures that only the intra-day price changes are included in the RSI calculation.
Intra-day Price Movement: The RSI calculations are based on real price changes within each trading day, providing a clearer reflection of momentum without interference from overnight events.
Dynamic RSI Calculation: The traditional RSI formula is preserved, but gains and losses are recalculated based on price changes from bar to bar within the same day.
Overbought/Oversold Levels: The indicator retains standard RSI overbought (70) and oversold (30) levels, allowing traders to easily identify potential reversal zones.
Alerts for Crossovers: Built-in alert conditions trigger when the RSI crosses key levels (30 or 70), signaling potential buying or selling opportunities.
This indicator is particularly useful for traders looking to focus on intra-day price action and avoid the influence of gaps caused by overnight market activity. It is suitable for intraday trading strategies where consistency in price movement measurement is crucial.
Mã nguồn mở
Theo đúng tinh thần TradingView, tác giả của tập lệnh này đã công bố nó dưới dạng mã nguồn mở, để các nhà giao dịch có thể xem xét và xác minh chức năng. Chúc mừng tác giả! Mặc dù bạn có thể sử dụng miễn phí, hãy nhớ rằng việc công bố lại mã phải tuân theo Nội quy.
Thông báo miễn trừ trách nhiệm
Thông tin và các ấn phẩm này không nhằm mục đích, và không cấu thành, lời khuyên hoặc khuyến nghị về tài chính, đầu tư, giao dịch hay các loại khác do TradingView cung cấp hoặc xác nhận. Đọc thêm tại Điều khoản Sử dụng.