OPEN-SOURCE SCRIPT
Action Trend Line
Action Trend Line is different of Moving Average between ema26 and ema260
My idea is, if ema26 drop to ema260 means downtrend
if ema26 increase or moving out of ema260 means uptrend
then writting a different line by 100 scale to be clear vision
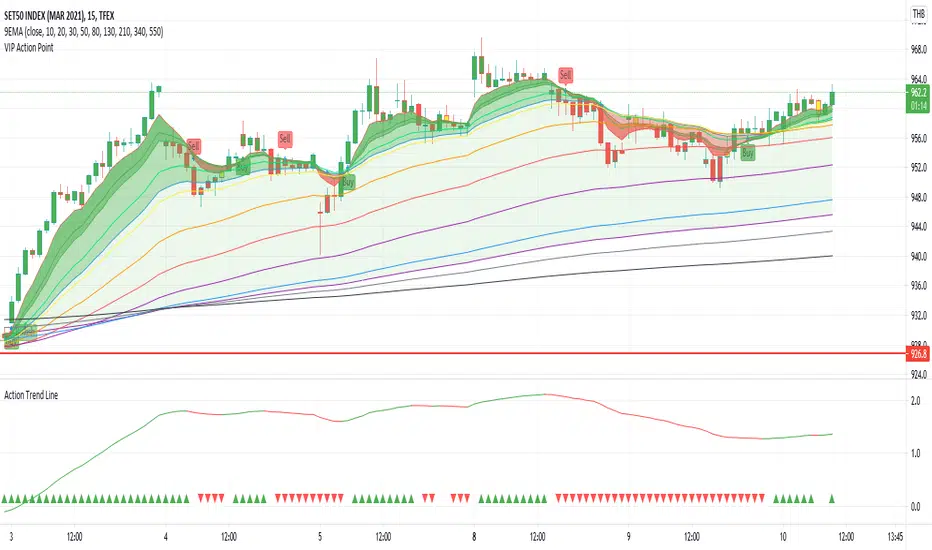
at the bottom have plot sign up and down for each candle, it is status information
The chart show Action Trend Line, by 2 color and 2 sign at the bottom of chart.
If the line is growing up then color is green. you could know that is uptrend.
If the line is going down then color is red. you could know that is downtrend.
The triangle sign at the bottom of chart show trend folowing.
If previous and this line are uptrend, the triangle up and green color.
If previous and this line are downtrend, the triangle down and redcolor.
otherwise, the trend going to change it dosen't plot any sign, you cloud know warning the trend going to be change.
Must try and make you clearly understand.
My idea is, if ema26 drop to ema260 means downtrend
if ema26 increase or moving out of ema260 means uptrend
then writting a different line by 100 scale to be clear vision
at the bottom have plot sign up and down for each candle, it is status information
The chart show Action Trend Line, by 2 color and 2 sign at the bottom of chart.
If the line is growing up then color is green. you could know that is uptrend.
If the line is going down then color is red. you could know that is downtrend.
The triangle sign at the bottom of chart show trend folowing.
If previous and this line are uptrend, the triangle up and green color.
If previous and this line are downtrend, the triangle down and redcolor.
otherwise, the trend going to change it dosen't plot any sign, you cloud know warning the trend going to be change.
Must try and make you clearly understand.
Mã nguồn mở
Theo đúng tinh thần TradingView, tác giả của tập lệnh này đã công bố nó dưới dạng mã nguồn mở, để các nhà giao dịch có thể xem xét và xác minh chức năng. Chúc mừng tác giả! Mặc dù bạn có thể sử dụng miễn phí, hãy nhớ rằng việc công bố lại mã phải tuân theo Nội quy.
Thông báo miễn trừ trách nhiệm
Thông tin và các ấn phẩm này không nhằm mục đích, và không cấu thành, lời khuyên hoặc khuyến nghị về tài chính, đầu tư, giao dịch hay các loại khác do TradingView cung cấp hoặc xác nhận. Đọc thêm tại Điều khoản Sử dụng.