OPEN-SOURCE SCRIPT
Cập nhật Multi-Timeframe Candles Histograms
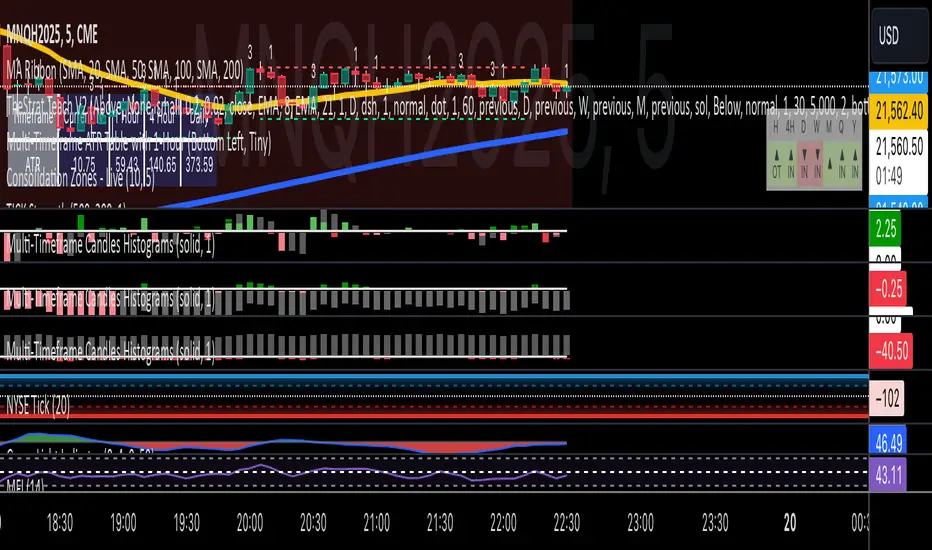
At some community members' requests, I have built on the original code to make it a single indicator with the option for users to check off which timeframes they want to be shown. Choices are 1-hour, daily, weekly, and monthly.
I couldn't figure out how to separate each timeframe into its own histogram, so this is the best I can offer at the moment. If any community member wants to take a crack at it, be my guest.
Colors are customizable.
If you have a paid TW account, you can lay it down twice and put the hour and daily on one and the weekly and monthly on the other.
That said, I hope you enjoy this version of this indicator.
R.I.P. Rob Smith, creator of TheStrat.
---
Key Features and Benefits
1. Custom Timeframe Selection:
- Choose from an array of timeframes ranging from minutes to months, giving you complete flexibility in your market analysis.
- Quickly switch between different timeframes (e.g., 1-hour, daily, or weekly) to track continuity across varying levels.
2. Visual Representation of High/Low Markers:
- Enable or disable the display of high and low points to better understand price ranges and reversals.
- These markers allow you to spot key turning points on different timeframes, facilitating better entry or exit decisions.
3. Enhanced Candle Visualization:
- Displays candles with precise price levels aligned to your chosen timeframe, giving a clearer view of price trends.
- Candles are color-coded to reflect price movement, which is customizable by the user.
---
How to Use This Indicator
Monitor Multiple Timeframes Simultaneously:
- Place the indicator on your chart and choose the timeframes you want to follow (e.g., hourly, daily, weekly, monthly).
- For each instance, checkmark the desired timeframes in the menu to ensure that you’re tracking the right period.
Achieve Timeframe Continuity:
- By aligning lower timeframes with higher ones, this tool helps you confirm trends, detect reversals, and avoid trades that go against the broader market movement.
---
Why This Indicator is Valuable for Traders
This tool simplifies a core principle of TheStrat—full timeframe continuity—by visually representing price action across multiple timeframes in a clear and actionable way. It removes the guesswork and helps traders stay in sync with market momentum, regardless of the timeframe they are analyzing.
This solution offers flexibility, clarity, and speed, enabling traders to quickly grasp critical movements and improve decision-making. Whether you are a scalper focusing on intraday moves or a swing trader watching weekly trends, this tool empowers you to maintain alignment with the overall market structure.
In essence, it brings the power of TheStrat to your fingertips by offering precise and easy-to-read visual aids, allowing you to seamlessly apply Rob Smith’s philosophy to your trading.
Phát hành các Ghi chú
Update the name of the script in the code. No other changes.Phát hành các Ghi chú
New version to include the option for users to choose the 1-min, 5-min, 15-min, and 30-min timeframes.I hope it helps you all!
#thestrat
Phát hành các Ghi chú
Added the ability for the user to put a zero line on the indicator.No other changes.
Mã nguồn mở
Theo đúng tinh thần TradingView, tác giả của tập lệnh này đã công bố nó dưới dạng mã nguồn mở, để các nhà giao dịch có thể xem xét và xác minh chức năng. Chúc mừng tác giả! Mặc dù bạn có thể sử dụng miễn phí, hãy nhớ rằng việc công bố lại mã phải tuân theo Nội quy.
Thông báo miễn trừ trách nhiệm
Thông tin và các ấn phẩm này không nhằm mục đích, và không cấu thành, lời khuyên hoặc khuyến nghị về tài chính, đầu tư, giao dịch hay các loại khác do TradingView cung cấp hoặc xác nhận. Đọc thêm tại Điều khoản Sử dụng.