OPEN-SOURCE SCRIPT
Previous 4-Hour High/Low
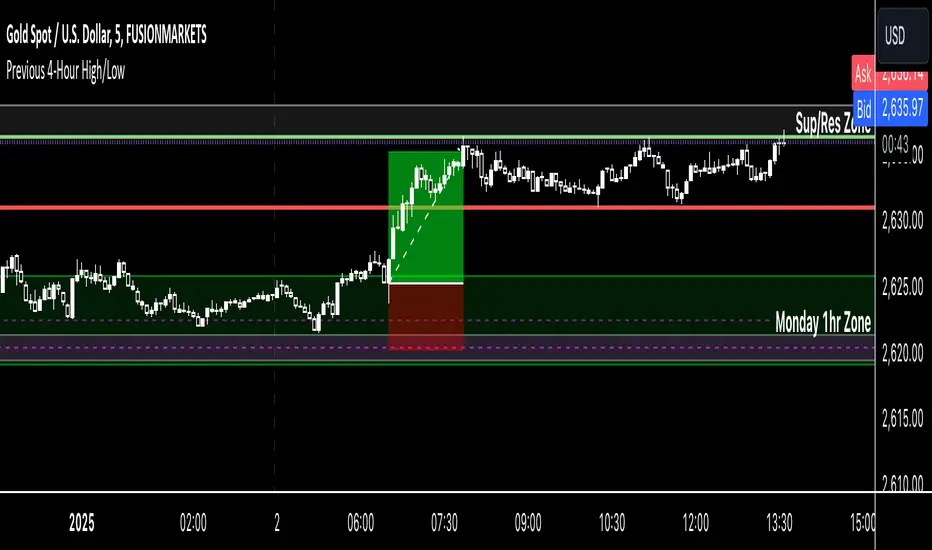
Indicator Name: Previous 4-Hour High/Low Lines
Description:
This indicator highlights the high and low levels of the previous candle from a user-defined timeframe (default: 4 hours) and extends these levels both to the left and right across the chart. It allows traders to visualize key support and resistance levels from higher timeframes while analyzing lower timeframe charts.
Key Features:
• Customizable Timeframe: Select any timeframe (e.g., 4-hour, daily) to track the high and low of the previous candle.
• Dynamic Updates: The high and low levels update automatically with each new candle.
• Extended Levels: Lines extend both left and right, providing a clear reference for past and future price action.
• Overlay on Chart: The indicator works seamlessly on any timeframe, making it ideal for multi-timeframe analysis.
Use Case:
This tool is perfect for traders who rely on higher timeframe levels for setting entry/exit points, identifying potential breakout zones, or managing risk. By visualizing these levels directly on lower timeframe charts, traders can make informed decisions without switching between charts.
Mã nguồn mở
Theo đúng tinh thần TradingView, tác giả của tập lệnh này đã công bố nó dưới dạng mã nguồn mở, để các nhà giao dịch có thể xem xét và xác minh chức năng. Chúc mừng tác giả! Mặc dù bạn có thể sử dụng miễn phí, hãy nhớ rằng việc công bố lại mã phải tuân theo Nội quy.
Thông báo miễn trừ trách nhiệm
Thông tin và các ấn phẩm này không nhằm mục đích, và không cấu thành, lời khuyên hoặc khuyến nghị về tài chính, đầu tư, giao dịch hay các loại khác do TradingView cung cấp hoặc xác nhận. Đọc thêm tại Điều khoản Sử dụng.