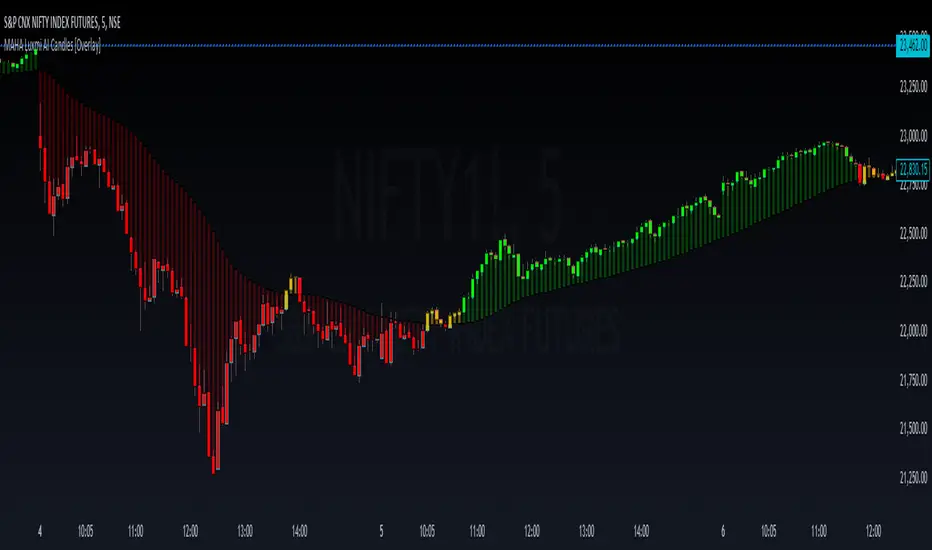
MAHA Luxmi AI Candles [Overlay]
1. Integration of MA and HA Techniques
MAHA stands for Moving Average and Heikin-Ashi. This indicator modifies these traditional techniques with a unique custom formula, aiming to provide more accurate and reliable signals for traders. The combination enhances the smoothing effect of Moving Averages with the trend indication of Heikin-Ashi candles.
2. Four-Colored Candles for Trend Indication
The indicator uses a color-coded system to denote different market conditions and potential trading opportunities:
- Green Candles: These candles indicate a potential long opportunity. The appearance of a green candle suggests that the market is showing bullish tendencies, prompting traders to consider entering a long position.
- Blue Candles: These candles signify an active pullback within a bullish trend. The blue candle warns traders of a possible temporary reversal within the overall bullish trend, suggesting caution and the need for confirmation before continuing with a long position or preparing for a potential reversal.
- Red Candles: These candles represent a potential short opportunity. A red candle indicates bearish market conditions, signaling traders to consider entering a short position.
- Yellow Candles: These candles denote an active pullback within a bearish trend. The presence of a yellow candle indicates a temporary reversal within the bearish trend, urging traders to be cautious with short positions and look for signs of continuation or reversal.
3. MAHA Bars for Distance and Area of Interest
In addition to the colored candles, the MAHA Luxmi AI Candles [Overlay] indicator also plots MAHA bars. These bars share the same color coding and usage as the candles, providing a consistent visual representation of market conditions:
- Green Bars: Indicate a potential long opportunity, aligning with green candles.
- Blue Bars: Show an active pullback in a bullish trend, aligning with blue candles.
- Red Bars: Represent a potential short opportunity, aligning with red candles.
- Yellow Bars: Indicate an active pullback in a bearish trend, aligning with yellow candles.
The MAHA bars help traders gauge the distance between the current price and the area of interest, enhancing their understanding of how close or far the price is from key levels identified by the MAHA formula. This aids in making better decisions regarding entry and exit points.
4. Trailing Stop Loss Feature
The base of the MAHA Bars can also be used as a trailing stop loss. This feature provides a dynamic stop loss level that adjusts with the market, helping traders lock in profits and limit losses by following the trend. When the price moves favorably, the trailing stop loss adjusts accordingly, ensuring that traders can capitalize on market movements while minimizing risk.
Usage and Benefits
- Trend Identification: The color-coded system simplifies the identification of market trends and potential reversals, making it easier for traders to understand market dynamics at a glance.
- Pullback and Reversal Alerts: The blue and yellow candles/bars alert traders to potential pullbacks and reversals, providing crucial information for managing trades and avoiding false signals.
- Distance Measurement: The MAHA bars help traders measure the distance between the current price and the areas of interest, enhancing their ability to assess the risk and potential reward of trades.
- Trailing Stop Loss: The base of the MAHA Bars can be used as a trailing stop loss, providing a dynamic risk management tool that adapts to market conditions.
Overall, the MAHA Luxmi AI Candles [Overlay] trading indicator is a powerful tool for traders looking to leverage the combined strengths of Moving Averages and Heikin-Ashi techniques. The intuitive color-coded system, additional MAHA bars, and the trailing stop loss feature make it an essential component of a trader’s toolkit for identifying trends, managing risk, and identifying trading opportunities.
Tập lệnh chỉ hiển thị cho người được mời
Chỉ những người dùng được tác giả chấp thuận mới có thể truy cập tập lệnh này. Bạn sẽ cần yêu cầu và được cấp quyền sử dụng. Thông thường quyền này được cấp sau khi thanh toán. Để biết thêm chi tiết, làm theo hướng dẫn của tác giả bên dưới hoặc liên hệ trực tiếp với LuxmiAI.
TradingView KHÔNG khuyến nghị bạn trả phí hoặc sử dụng một tập lệnh trừ khi bạn hoàn toàn tin tưởng vào tác giả và hiểu cách hoạt động của tập lệnh. Bạn cũng có thể tìm các lựa chọn miễn phí, mã nguồn mở trong các script cộng đồng của chúng tôi.
Hướng dẫn của tác giả
Thông báo miễn trừ trách nhiệm
Tập lệnh chỉ hiển thị cho người được mời
Chỉ những người dùng được tác giả chấp thuận mới có thể truy cập tập lệnh này. Bạn sẽ cần yêu cầu và được cấp quyền sử dụng. Thông thường quyền này được cấp sau khi thanh toán. Để biết thêm chi tiết, làm theo hướng dẫn của tác giả bên dưới hoặc liên hệ trực tiếp với LuxmiAI.
TradingView KHÔNG khuyến nghị bạn trả phí hoặc sử dụng một tập lệnh trừ khi bạn hoàn toàn tin tưởng vào tác giả và hiểu cách hoạt động của tập lệnh. Bạn cũng có thể tìm các lựa chọn miễn phí, mã nguồn mở trong các script cộng đồng của chúng tôi.