OPEN-SOURCE SCRIPT
Cập nhật Half Trend HeikinAshi [BigBeluga]
This indicator is a cool combo of the half-trend methodology and Heikin Ashi candles. The main idea is to help spot where the market is trending and where it might be reversing by using a mix of moving averages and the highest and lowest price data values. What’s nice is that it doesn’t just give you trend lines but also converts them into Heikin Ashi candles, so you can visually gauge the strength of a trend based on candle sizes.
NIFTY50:

NVIDIA:

🔵 IDEA
The thinking behind this Half Trend HeikinAshi indicator is pretty straightforward: it’s designed to give you a flexible way to detect trends and trend reversals, but with an added bonus—measuring trend strength via Heikin Ashi candles. The core idea is based on the classic half-trend strategy, where it adjusts to the highest and lowest price values within a certain period. The Heikin Ashi transformation smooths out half-trend line, making it easier to spot solid trends and potential reversals.
🔵 KEY FEATURES & USAGE
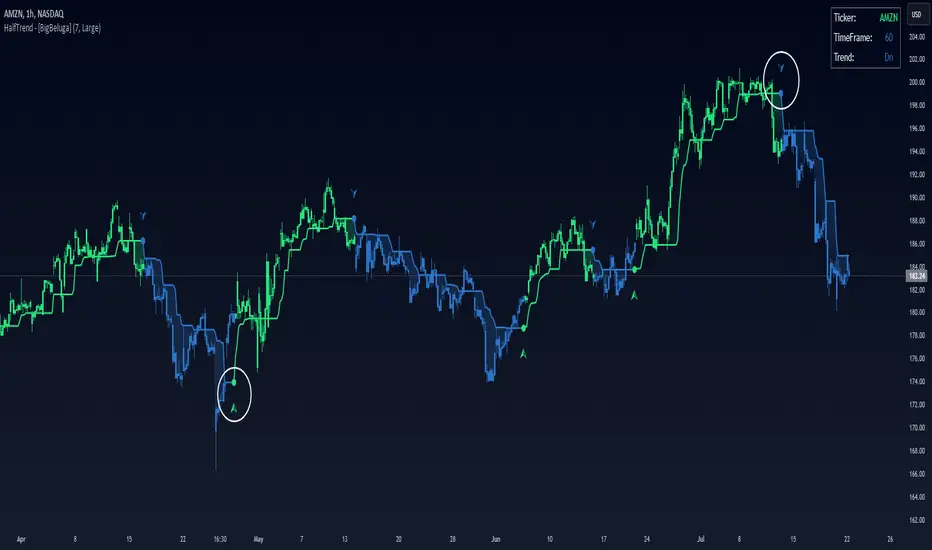
◉ Half Trend Calculation with Reversal Signals:
The main feature here is spotting trends based on a moving average of the close price and the highest/lowest price data.
Pine Script®
When the trend flips, you’ll see arrows on your chart—either pointing up or down—marking the exact price where that reversal occurred. This makes it easy to see where the market might turn, which is helpful for timing entries and exits.

◉ Heikin Ashi Candlestick Transformation:
There’s a Heikin Ashi mode that transforms the half-trend line into Heikin Ashi candles.
These smooth out market noise and make the overall trend much clearer.

◉ Trend Strength Calculation:
The indicator doesn’t just stop at showing trends. It also calculates trend strength based on the size of the Heikin Ashi candles. Bigger candles mean stronger trends, and smaller ones indicate weaker momentum. You can see this displayed on the dashboard, so you know exactly how strong the current trend is at any moment.


◉ Graphical Dashboard Display:
You’ve got a small dashboard right on the chart that shows key info like the ticker, timeframe, and whether the trend is up or down. If you’re in Heikin Ashi mode, it shows trend strength instead. So, no need to dig through the data—you can just glance at the dashboard for a quick market read.

🔵 CUSTOMIZATION
🔵 CONCLUSION
The Half Trend HeikinAshi indicator is a solid tool for tracking trends and measuring their strength. By combining the usual half-trend signals with Heikin Ashi candles, you get a clearer picture of what’s happening in the market. Whether you're looking to spot potential reversals or just want to measure the strength of a current trend, this indicator gives you plenty of flexibility to do both.
NIFTY50:
NVIDIA:
🔵 IDEA
The thinking behind this Half Trend HeikinAshi indicator is pretty straightforward: it’s designed to give you a flexible way to detect trends and trend reversals, but with an added bonus—measuring trend strength via Heikin Ashi candles. The core idea is based on the classic half-trend strategy, where it adjusts to the highest and lowest price values within a certain period. The Heikin Ashi transformation smooths out half-trend line, making it easier to spot solid trends and potential reversals.
🔵 KEY FEATURES & USAGE
◉ Half Trend Calculation with Reversal Signals:
The main feature here is spotting trends based on a moving average of the close price and the highest/lowest price data.
//#region ———————————————————— Calculations
// Calculate moving average of close prices
series float closeMA = ta.sma(close, amplitude)
// Calculate highest high and lowest low
series float highestHigh = ta.highest(amplitude)
series float lowestLow = ta.lowest(amplitude)
// Initialize hl_t on the first bar
if barstate.isfirst
hl_t := close
// Update hl_t based on conditions
switch
closeMA < hl_t and highestHigh < hl_t => hl_t := highestHigh
closeMA > hl_t and lowestLow > hl_t => hl_t := lowestLow
=> hl_t := hl_t
When the trend flips, you’ll see arrows on your chart—either pointing up or down—marking the exact price where that reversal occurred. This makes it easy to see where the market might turn, which is helpful for timing entries and exits.
◉ Heikin Ashi Candlestick Transformation:
There’s a Heikin Ashi mode that transforms the half-trend line into Heikin Ashi candles.
These smooth out market noise and make the overall trend much clearer.
◉ Trend Strength Calculation:
The indicator doesn’t just stop at showing trends. It also calculates trend strength based on the size of the Heikin Ashi candles. Bigger candles mean stronger trends, and smaller ones indicate weaker momentum. You can see this displayed on the dashboard, so you know exactly how strong the current trend is at any moment.
◉ Graphical Dashboard Display:
You’ve got a small dashboard right on the chart that shows key info like the ticker, timeframe, and whether the trend is up or down. If you’re in Heikin Ashi mode, it shows trend strength instead. So, no need to dig through the data—you can just glance at the dashboard for a quick market read.
🔵 CUSTOMIZATION
- Amplitude Input: You can tweak the amplitude to control how sensitive the half-trend line is. A lower setting makes it more reactive to small price moves, while a higher setting smooths it out for longer-term trends.
- Heikin Ashi Toggle: You can easily switch between standard half-trend lines and Heikin Ashi candle mode, depending on how you prefer to see the market.
- Trend Colors: You’ve got control over the colors for up and down trends, so you can adjust the appearance to fit your charting style.
- Signal Labels size: Change Labels signal sizes for your preference
🔵 CONCLUSION
The Half Trend HeikinAshi indicator is a solid tool for tracking trends and measuring their strength. By combining the usual half-trend signals with Heikin Ashi candles, you get a clearer picture of what’s happening in the market. Whether you're looking to spot potential reversals or just want to measure the strength of a current trend, this indicator gives you plenty of flexibility to do both.
Phát hành các Ghi chú
- Update: Confirmation of signals after candle closeMã nguồn mở
Theo đúng tinh thần TradingView, tác giả của tập lệnh này đã công bố nó dưới dạng mã nguồn mở, để các nhà giao dịch có thể xem xét và xác minh chức năng. Chúc mừng tác giả! Mặc dù bạn có thể sử dụng miễn phí, hãy nhớ rằng việc công bố lại mã phải tuân theo Nội quy.
🔵Gain access to our powerful tools : bigbeluga.com/tv
🔵Join our free discord for updates : bigbeluga.com/discord
All scripts & content provided by BigBeluga are for informational & educational purposes only.
🔵Join our free discord for updates : bigbeluga.com/discord
All scripts & content provided by BigBeluga are for informational & educational purposes only.
Thông báo miễn trừ trách nhiệm
Thông tin và các ấn phẩm này không nhằm mục đích, và không cấu thành, lời khuyên hoặc khuyến nghị về tài chính, đầu tư, giao dịch hay các loại khác do TradingView cung cấp hoặc xác nhận. Đọc thêm tại Điều khoản Sử dụng.
Mã nguồn mở
Theo đúng tinh thần TradingView, tác giả của tập lệnh này đã công bố nó dưới dạng mã nguồn mở, để các nhà giao dịch có thể xem xét và xác minh chức năng. Chúc mừng tác giả! Mặc dù bạn có thể sử dụng miễn phí, hãy nhớ rằng việc công bố lại mã phải tuân theo Nội quy.
🔵Gain access to our powerful tools : bigbeluga.com/tv
🔵Join our free discord for updates : bigbeluga.com/discord
All scripts & content provided by BigBeluga are for informational & educational purposes only.
🔵Join our free discord for updates : bigbeluga.com/discord
All scripts & content provided by BigBeluga are for informational & educational purposes only.
Thông báo miễn trừ trách nhiệm
Thông tin và các ấn phẩm này không nhằm mục đích, và không cấu thành, lời khuyên hoặc khuyến nghị về tài chính, đầu tư, giao dịch hay các loại khác do TradingView cung cấp hoặc xác nhận. Đọc thêm tại Điều khoản Sử dụng.