OPEN-SOURCE SCRIPT
ZIP Entry Strategy( Using 50 SMA and 100 SMA)
Description:
This strategy uses only two simple moving averages, specifically the 50 SMA and the 100 SMA.
Simple moving average : A simple moving average (SMA) calculates the average of a selected range of prices, usually closing prices, by the number of periods in that range.
Here's how it works:
Background color:
The chart background is colored green when the price is above the 100 SMA.
The chart background turns red when the price is below the 100 SMA.
The greenback ground suggest the bullish momentum and the red background suggests the bearish momentum.
We can use this long term trend to take the trades in alignment with the trend to increase our odds.
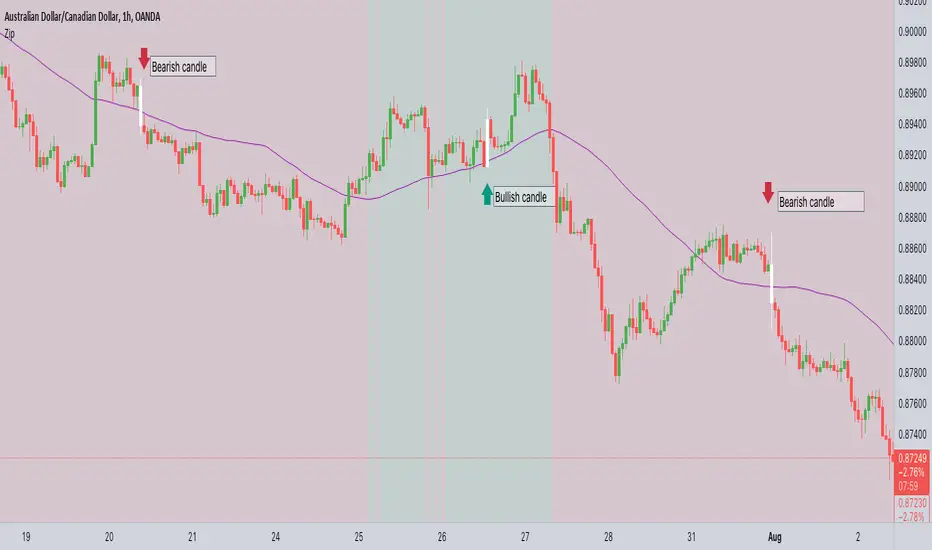
We will use the 50 SMA to identify the spots when a new trend is starting. When the price crosses above the 50 SMA while the background is green, the candle/bar color changes to white indicating a new trend beginning.
Conversely, when the price crosses below the 50 SMA while the background is red, the candle/bar color also changes to white indicating a new trend beginning.
The occurrence of white candles indicates the start of a potential new trend in alignment with the long term trend.
However, it's essential to remember that like any trading strategy, this one is not perfect. For more reliable results, it's advisable to combine it with a consideration of the overall price structure to minimize false entry signals.
Originality and usefulness
Even though it makes use of two moving averages, we don't use the moving average crossover. The moving average crossovers are either lagging or provide too many false signals. We have tried to address these issue with this strategy. While maintaining the long-term trend and ignoring false signals, it gives out signals early.
You can choose the moving average that best suits your needs by changing these moving averages to a different moving average . The 50 SMA and 100 SMA appeared to be giving the better signals in my experience.
I dont use any other indicators but i would like to check the price structure to make sure its moving along with the 50 SMA. Sometimes the choppy markets might give false signals.
Its okay to see multiple white candles as long as the price structure holds.
I have highlighted the white candles in the above chart. The color of the candle is always the same so the background decides whether its bearish or bullish cross
This strategy uses only two simple moving averages, specifically the 50 SMA and the 100 SMA.
Simple moving average : A simple moving average (SMA) calculates the average of a selected range of prices, usually closing prices, by the number of periods in that range.
Here's how it works:
Background color:
The chart background is colored green when the price is above the 100 SMA.
The chart background turns red when the price is below the 100 SMA.
The greenback ground suggest the bullish momentum and the red background suggests the bearish momentum.
We can use this long term trend to take the trades in alignment with the trend to increase our odds.
We will use the 50 SMA to identify the spots when a new trend is starting. When the price crosses above the 50 SMA while the background is green, the candle/bar color changes to white indicating a new trend beginning.
Conversely, when the price crosses below the 50 SMA while the background is red, the candle/bar color also changes to white indicating a new trend beginning.
The occurrence of white candles indicates the start of a potential new trend in alignment with the long term trend.
However, it's essential to remember that like any trading strategy, this one is not perfect. For more reliable results, it's advisable to combine it with a consideration of the overall price structure to minimize false entry signals.
Originality and usefulness
Even though it makes use of two moving averages, we don't use the moving average crossover. The moving average crossovers are either lagging or provide too many false signals. We have tried to address these issue with this strategy. While maintaining the long-term trend and ignoring false signals, it gives out signals early.
You can choose the moving average that best suits your needs by changing these moving averages to a different moving average . The 50 SMA and 100 SMA appeared to be giving the better signals in my experience.
I dont use any other indicators but i would like to check the price structure to make sure its moving along with the 50 SMA. Sometimes the choppy markets might give false signals.
Its okay to see multiple white candles as long as the price structure holds.
I have highlighted the white candles in the above chart. The color of the candle is always the same so the background decides whether its bearish or bullish cross
Mã nguồn mở
Theo đúng tinh thần TradingView, tác giả của tập lệnh này đã công bố nó dưới dạng mã nguồn mở, để các nhà giao dịch có thể xem xét và xác minh chức năng. Chúc mừng tác giả! Mặc dù bạn có thể sử dụng miễn phí, hãy nhớ rằng việc công bố lại mã phải tuân theo Nội quy.
Thông báo miễn trừ trách nhiệm
Thông tin và các ấn phẩm này không nhằm mục đích, và không cấu thành, lời khuyên hoặc khuyến nghị về tài chính, đầu tư, giao dịch hay các loại khác do TradingView cung cấp hoặc xác nhận. Đọc thêm tại Điều khoản Sử dụng.