OPEN-SOURCE SCRIPT
Buy/Sell Volume Balance
DESCRIPTION
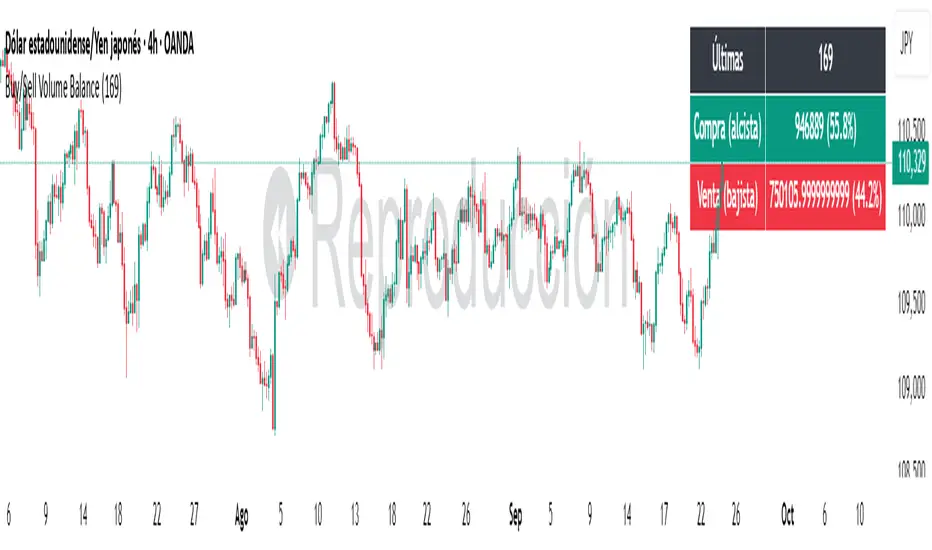
Buy/Sell Volume Balance is a simple yet powerful indicator designed to measure and visualize the balance between buying and selling volume over a customizable number of recent candles. It helps traders quickly assess market pressure during consolidation phases or ranges, in order to anticipate the most likely breakout direction.
How it works
The indicator analyzes the last N candles (default = 100, user-editable).
Each candle’s total volume is classified as:
Bullish volume (Buy volume): if the candle closes above or equal to its open.
Bearish volume (Sell volume): if the candle closes below its open.
The volumes are summed separately to calculate:
Total Buy Volume
Total Sell Volume
The percentage of each side relative to the total is also displayed.
All results are shown in a fixed table at the top of the chart for quick interpretation.
Purpose
This tool is specifically designed to help traders evaluate the internal battle between buyers and sellers during a range or sideways market. By understanding which side is accumulating more volume within the range, traders can anticipate which direction is more likely when the price breaks out.
If Buy volume dominates → potential bullish breakout.
If Sell volume dominates → potential bearish breakout.
If both sides are nearly balanced, it signals indecision and a higher chance of false breakouts.
Imbalance Threshold
In practice, traders often consider a clear imbalance when one side reaches at least 55–60% of the total volume.
Above this threshold, the dominant side is more likely to dictate the breakout direction.
Below this threshold, the market is usually in indecision and further confirmation is needed before acting.
How to use it
Add the indicator to your chart and choose the lookback period (number of candles).
Focus on ranges or consolidation zones where price is moving sideways.
Observe the balance of Buy vs Sell volume in the top-right box:
A clear imbalance (>55–60%) suggests the stronger side is more likely to push the breakout.
A balanced ratio (<55–60%) indicates indecision and possible false breakouts.
Use it in combination with support/resistance zones, breakout patterns, or volume spikes for best results.
✅ In summary: This indicator does not give direct buy/sell signals, but it provides valuable context about market pressure, helping you to align your trades with the most probable breakout direction.
Mã nguồn mở
Theo đúng tinh thần TradingView, tác giả của tập lệnh này đã công bố nó dưới dạng mã nguồn mở, để các nhà giao dịch có thể xem xét và xác minh chức năng. Chúc mừng tác giả! Mặc dù bạn có thể sử dụng miễn phí, hãy nhớ rằng việc công bố lại mã phải tuân theo Nội quy.
Thông báo miễn trừ trách nhiệm
Thông tin và các ấn phẩm này không nhằm mục đích, và không cấu thành, lời khuyên hoặc khuyến nghị về tài chính, đầu tư, giao dịch hay các loại khác do TradingView cung cấp hoặc xác nhận. Đọc thêm tại Điều khoản Sử dụng.