OPEN-SOURCE SCRIPT
Cập nhật Multi-timeframe Trend & Momentum Dashboard
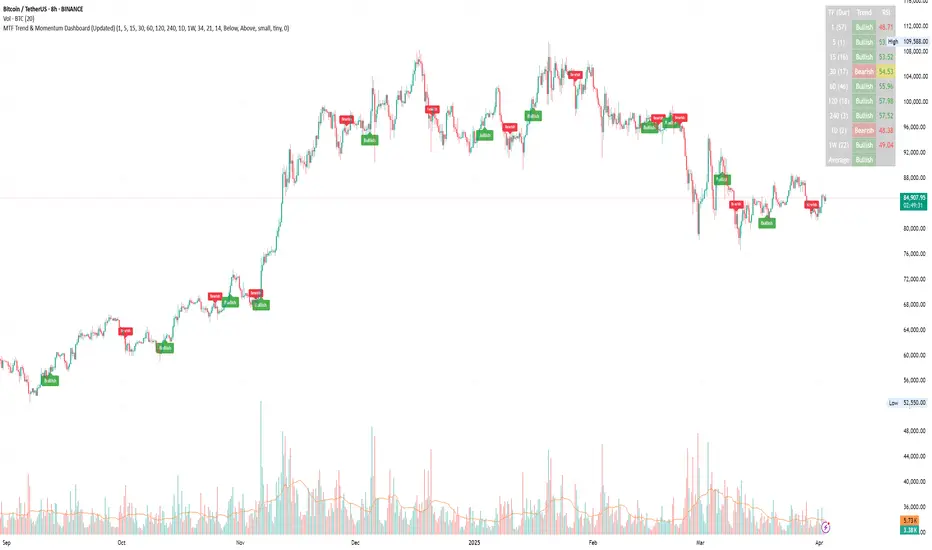
Multi-Timeframe Trend & Momentum Dashboard
This indicator is a comprehensive multi-timeframe analysis tool designed for traders who want to quickly assess market trends and momentum across several timeframes. It combines trend detection with duration tracking and displays key information in an easy-to-read on-chart table. Key features include:
Multi-Timeframe Analysis:
Analyzes nine different timeframes (from 1-minute up to 1-week) simultaneously, helping you gauge the overall market trend at a glance.
Trend Detection & Duration:
Uses a combination of a short-term EMA and a long-term SMA to determine whether the market is bullish, bearish, or neutral. It also tracks how long the current trend has persisted in terms of consecutive bars and displays this duration next to each timeframe.
RSI Display & Visual Alerts:
Calculates the RSI for each timeframe. RSI values are color-coded—green when above 50 (indicating bullish momentum) and red when below 50 (indicating bearish conditions). Additionally, if the market is bearish on a particular timeframe while the RSI is above 50, the RSI cell flashes yellow to alert you of a potential trend reversal or divergence.
On-Chart Trend Start Markers:
When a new trend is detected on your current chart’s timeframe, the indicator automatically marks the bar with a label showing the new trend direction, providing a clear visual cue for trend changes.
This powerful tool is perfect for traders looking to combine multi-timeframe trend analysis with momentum indicators, enabling a more informed and dynamic trading strategy. Whether you’re a day trader or swing trader, the Multi-Timeframe Trend & Momentum Dashboard brings clarity to market conditions across multiple time horizons.
Phát hành các Ghi chú
Update DescriptionLabel Placement Options:
Added new inputs allowing the user to choose whether bullish labels appear above or below the bar (default set to “Above”) and bearish labels below or above the bar (default set to “Below”). This gives you control over where the trend start labels are placed on the chart.
Label Customization:
New inputs have been introduced for label customization. You can now select:
The background color for bullish and bearish labels.
The text color for each label.
The label size, with options such as “tiny,” “small,” “normal,” and “large.”
Phát hành các Ghi chú
Short Update DescriptionNew Table Options: Added an option to show or hide the trend/RSI table.
MA Diff Column: Included a new table column displaying the difference between the EMA and SMA.
Label Transparency: Introduced an input to adjust label transparency.
Phát hành các Ghi chú
.Mã nguồn mở
Theo đúng tinh thần TradingView, tác giả của tập lệnh này đã công bố nó dưới dạng mã nguồn mở, để các nhà giao dịch có thể xem xét và xác minh chức năng. Chúc mừng tác giả! Mặc dù bạn có thể sử dụng miễn phí, hãy nhớ rằng việc công bố lại mã phải tuân theo Nội quy.
Thông báo miễn trừ trách nhiệm
Thông tin và các ấn phẩm này không nhằm mục đích, và không cấu thành, lời khuyên hoặc khuyến nghị về tài chính, đầu tư, giao dịch hay các loại khác do TradingView cung cấp hoặc xác nhận. Đọc thêm tại Điều khoản Sử dụng.
Mã nguồn mở
Theo đúng tinh thần TradingView, tác giả của tập lệnh này đã công bố nó dưới dạng mã nguồn mở, để các nhà giao dịch có thể xem xét và xác minh chức năng. Chúc mừng tác giả! Mặc dù bạn có thể sử dụng miễn phí, hãy nhớ rằng việc công bố lại mã phải tuân theo Nội quy.
Thông báo miễn trừ trách nhiệm
Thông tin và các ấn phẩm này không nhằm mục đích, và không cấu thành, lời khuyên hoặc khuyến nghị về tài chính, đầu tư, giao dịch hay các loại khác do TradingView cung cấp hoặc xác nhận. Đọc thêm tại Điều khoản Sử dụng.