OPEN-SOURCE SCRIPT
Asset Selection Indicator by [VanHelsing]
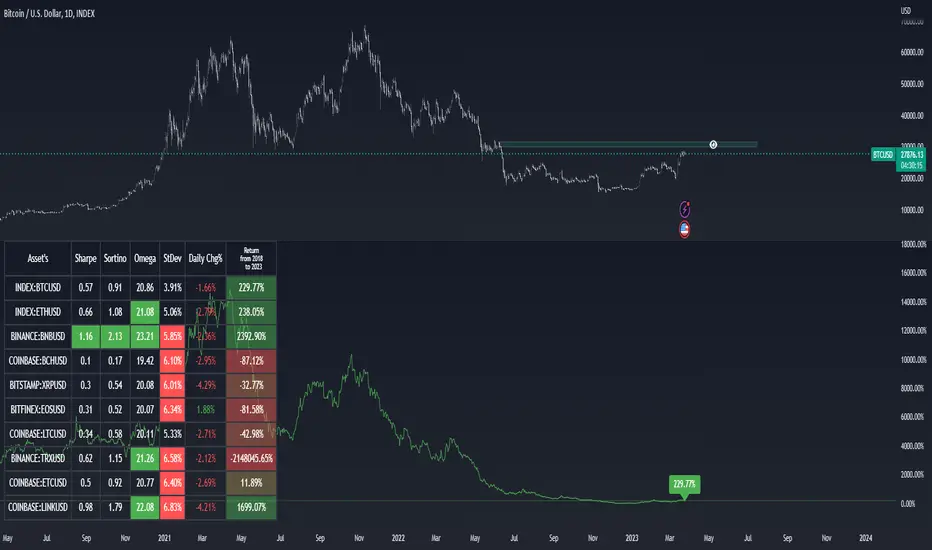
Asset Selection Indicator
This is a table what will help you to see what asset's are optimal to use in your portfolio or strategies.
By different metrics what are ploted on a table you will see how each individual asset performe compare to other
Sharpe, sortino, omega ratio's are very valueble metriscs in bulding portfolio and now you can easly see them without difficult calculations.
Do you want to know return of asset for 3, 5, 2 years? You are welcome to choose in settings whatever period you want, the same for other metrics
Below is instruction how to use this indicator:
(Explanation of Settings for a period of data)

(Asset selection by Sharpe, Omega, Sortino, StDev)

(How to plot Equity)

And a nice bonus is an alert!
(you can send it to a spreadsheet like I explained in other my indicator "Stock Correlation Table")

This is a table what will help you to see what asset's are optimal to use in your portfolio or strategies.
By different metrics what are ploted on a table you will see how each individual asset performe compare to other
Sharpe, sortino, omega ratio's are very valueble metriscs in bulding portfolio and now you can easly see them without difficult calculations.
Do you want to know return of asset for 3, 5, 2 years? You are welcome to choose in settings whatever period you want, the same for other metrics
Below is instruction how to use this indicator:
(Explanation of Settings for a period of data)
(Asset selection by Sharpe, Omega, Sortino, StDev)
(How to plot Equity)
And a nice bonus is an alert!
(you can send it to a spreadsheet like I explained in other my indicator "Stock Correlation Table")
Mã nguồn mở
Theo đúng tinh thần TradingView, tác giả của tập lệnh này đã công bố nó dưới dạng mã nguồn mở, để các nhà giao dịch có thể xem xét và xác minh chức năng. Chúc mừng tác giả! Mặc dù bạn có thể sử dụng miễn phí, hãy nhớ rằng việc công bố lại mã phải tuân theo Nội quy.
Thông báo miễn trừ trách nhiệm
Thông tin và các ấn phẩm này không nhằm mục đích, và không cấu thành, lời khuyên hoặc khuyến nghị về tài chính, đầu tư, giao dịch hay các loại khác do TradingView cung cấp hoặc xác nhận. Đọc thêm tại Điều khoản Sử dụng.