OPEN-SOURCE SCRIPT
Cập nhật OrderFlow Sentiment SwiftEdge
OrderFlow Sentiment SwiftEdge
Overview
OrderFlow Sentiment SwiftEdge is a visual indicator designed to help traders analyze market dynamics through a simulated orderbook and market sentiment display. It breaks down the current candlestick into 10 price bins, estimating buy and sell volumes, and presents this data in an orderbook table alongside a sentiment row showing the buy vs. sell bias. This tool provides a quick and intuitive way to assess orderflow activity and market sentiment directly on your chart.
How It Works
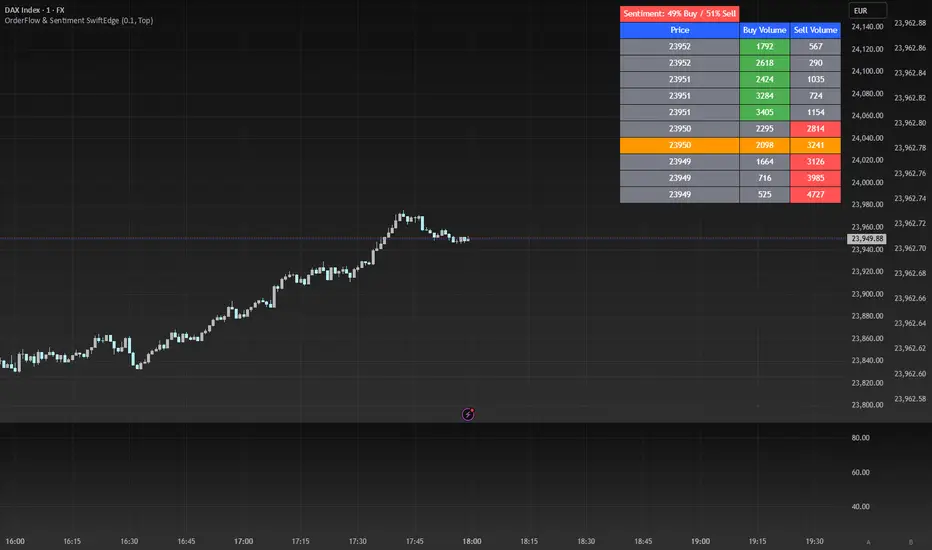
The indicator consists of two main components: an Orderbook Table and a Market Sentiment Row.
Orderbook Table:
Simulates buy and sell volumes for the current candlestick by distributing total volume into 10 price bins based on price movement and proximity to open/close levels.
Displays the price bins in a table with columns for Price, Buy Volume, and Sell Volume, sorted from highest to lowest price.
Highlights the current price level in orange for easy identification, while buy and sell dominance is indicated with green (buy) or red (sell) backgrounds.
Market Sentiment Row:
Calculates the overall buy and sell sentiment (as a percentage) for the current candlestick based on the simulated orderflow data.
Displays the sentiment above the orderbook table, with the background colored green if buyers dominate or red if sellers dominate.
Features
Customizable Colors: Choose colors for buy (default: green), sell (default: red), and current price (default: orange) levels.
Lot Scaling Factor: Adjust the volume scaling factor (default: 0.1 lots per volume unit) to simulate realistic lot sizes.
Table Position: Select the table position on the chart (Top, Middle, or Bottom; default: Middle).
Default Properties
Positive Color: Green
Negative Color: Red
Current Price Color: Orange
Lot Scaling Factor: 0.1
Table Position: Middle
Usage
This indicator is ideal for traders who want to visualize orderflow dynamics and market sentiment in real-time. The orderbook table provides a snapshot of buy and sell activity at different price levels within the current candlestick, helping you identify areas of high buying or selling pressure. The sentiment row offers a quick overview of market bias, allowing you to gauge whether buyers or sellers are currently dominating. Use this information to complement your trading decisions, such as identifying potential breakout levels or confirming trend direction.
Limitations
This indicator simulates orderflow data based on candlestick price movement and volume, as TradingView does not provide tick-by-tick data. The volume distribution is an approximation and should be used as a visual aid rather than a definitive measure of market activity.
The indicator operates on the chart's current timeframe and does not incorporate higher timeframe data.
The simulated volumes are scaled using a user-defined lot scaling factor, which may not reflect actual market lot sizes.
Disclaimer
This indicator is for informational purposes only and does not guarantee trading results. Always conduct your own analysis and manage risk appropriately. The simulated orderflow data is an estimation and may not reflect real market conditions.
Overview
OrderFlow Sentiment SwiftEdge is a visual indicator designed to help traders analyze market dynamics through a simulated orderbook and market sentiment display. It breaks down the current candlestick into 10 price bins, estimating buy and sell volumes, and presents this data in an orderbook table alongside a sentiment row showing the buy vs. sell bias. This tool provides a quick and intuitive way to assess orderflow activity and market sentiment directly on your chart.
How It Works
The indicator consists of two main components: an Orderbook Table and a Market Sentiment Row.
Orderbook Table:
Simulates buy and sell volumes for the current candlestick by distributing total volume into 10 price bins based on price movement and proximity to open/close levels.
Displays the price bins in a table with columns for Price, Buy Volume, and Sell Volume, sorted from highest to lowest price.
Highlights the current price level in orange for easy identification, while buy and sell dominance is indicated with green (buy) or red (sell) backgrounds.
Market Sentiment Row:
Calculates the overall buy and sell sentiment (as a percentage) for the current candlestick based on the simulated orderflow data.
Displays the sentiment above the orderbook table, with the background colored green if buyers dominate or red if sellers dominate.
Features
Customizable Colors: Choose colors for buy (default: green), sell (default: red), and current price (default: orange) levels.
Lot Scaling Factor: Adjust the volume scaling factor (default: 0.1 lots per volume unit) to simulate realistic lot sizes.
Table Position: Select the table position on the chart (Top, Middle, or Bottom; default: Middle).
Default Properties
Positive Color: Green
Negative Color: Red
Current Price Color: Orange
Lot Scaling Factor: 0.1
Table Position: Middle
Usage
This indicator is ideal for traders who want to visualize orderflow dynamics and market sentiment in real-time. The orderbook table provides a snapshot of buy and sell activity at different price levels within the current candlestick, helping you identify areas of high buying or selling pressure. The sentiment row offers a quick overview of market bias, allowing you to gauge whether buyers or sellers are currently dominating. Use this information to complement your trading decisions, such as identifying potential breakout levels or confirming trend direction.
Limitations
This indicator simulates orderflow data based on candlestick price movement and volume, as TradingView does not provide tick-by-tick data. The volume distribution is an approximation and should be used as a visual aid rather than a definitive measure of market activity.
The indicator operates on the chart's current timeframe and does not incorporate higher timeframe data.
The simulated volumes are scaled using a user-defined lot scaling factor, which may not reflect actual market lot sizes.
Disclaimer
This indicator is for informational purposes only and does not guarantee trading results. Always conduct your own analysis and manage risk appropriately. The simulated orderflow data is an estimation and may not reflect real market conditions.
Phát hành các Ghi chú
Chart updatetMã nguồn mở
Theo đúng tinh thần TradingView, tác giả của tập lệnh này đã công bố nó dưới dạng mã nguồn mở, để các nhà giao dịch có thể xem xét và xác minh chức năng. Chúc mừng tác giả! Mặc dù bạn có thể sử dụng miễn phí, hãy nhớ rằng việc công bố lại mã phải tuân theo Nội quy.
Thông báo miễn trừ trách nhiệm
Thông tin và các ấn phẩm này không nhằm mục đích, và không cấu thành, lời khuyên hoặc khuyến nghị về tài chính, đầu tư, giao dịch hay các loại khác do TradingView cung cấp hoặc xác nhận. Đọc thêm tại Điều khoản Sử dụng.
Mã nguồn mở
Theo đúng tinh thần TradingView, tác giả của tập lệnh này đã công bố nó dưới dạng mã nguồn mở, để các nhà giao dịch có thể xem xét và xác minh chức năng. Chúc mừng tác giả! Mặc dù bạn có thể sử dụng miễn phí, hãy nhớ rằng việc công bố lại mã phải tuân theo Nội quy.
Thông báo miễn trừ trách nhiệm
Thông tin và các ấn phẩm này không nhằm mục đích, và không cấu thành, lời khuyên hoặc khuyến nghị về tài chính, đầu tư, giao dịch hay các loại khác do TradingView cung cấp hoặc xác nhận. Đọc thêm tại Điều khoản Sử dụng.