OPEN-SOURCE SCRIPT
Cập nhật Volatility Visualizer by Oddbeaker LLC
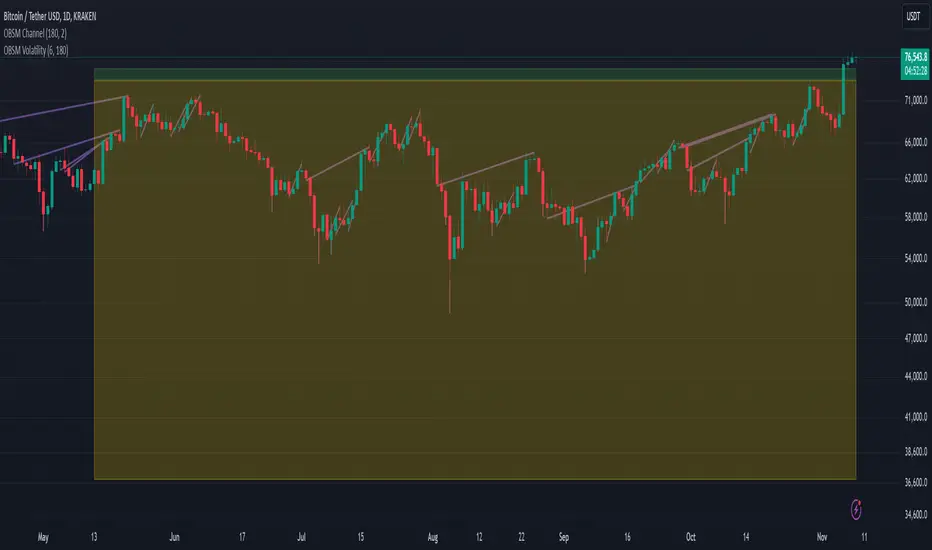
Use this to determine if a crypto pair has volatility suitable for your Oddbeaker Synthetic Miner. Draws entry/exit lines over the candles.
Inputs:
Notes:
Tips:
- "Show me every place on the chart where I could have made X percent gains in Y days or less."
Inputs:
- Percent Gain: Minimum percent gains to show on the chart.
- Scan Bars: Maximum number of bars allowed to reach the profit target.
Notes:
- Lines drawn on the chart indicate the entry and exit times and prices to reach the exact profit target.
- The indicator only uses the low price of each candle to determine entry. It does not show every possible entry point.
- When counting lines, count any group of lines that cross each other as one. Also, count any group of lines that do not cross but overlap in price over the same time period as one.
Tips:
- For best results, set Percent Gain to double the amount of the sum of Min Profit and Min Stash on your Synth Miner. Example: If you have minProfit=5 and minStash=5, 5+5=10, so percentGain should be 20 on the chart.
- Use a daily chart and set Scan Bars to 7 or less on highly volatile pairs.
- Look for charts with the highest number of lines that don't overlap.
- Use this indicator combined with the Synthetic Mining Channel for best results.
Phát hành các Ghi chú
2024-02-29- Added Line Color input, which I thought I had already done.
Phát hành các Ghi chú
- Indicator now shows single candles with a range larger than the percentGain
- Changed the default percentGain to 2
- Changed default line color and increased thickness
Mã nguồn mở
Theo đúng tinh thần TradingView, tác giả của tập lệnh này đã công bố nó dưới dạng mã nguồn mở, để các nhà giao dịch có thể xem xét và xác minh chức năng. Chúc mừng tác giả! Mặc dù bạn có thể sử dụng miễn phí, hãy nhớ rằng việc công bố lại mã phải tuân theo Nội quy.
Thông báo miễn trừ trách nhiệm
Thông tin và các ấn phẩm này không nhằm mục đích, và không cấu thành, lời khuyên hoặc khuyến nghị về tài chính, đầu tư, giao dịch hay các loại khác do TradingView cung cấp hoặc xác nhận. Đọc thêm tại Điều khoản Sử dụng.