OPEN-SOURCE SCRIPT
Racer Correlation [racer8]
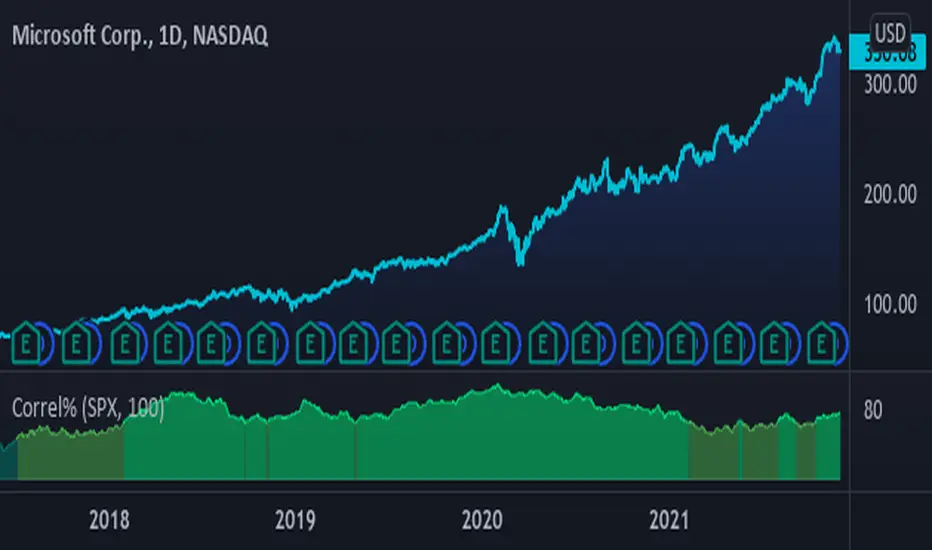
This indicator gauges correlation between 2 markets using my own method I invented. It is far superior to the correlation coefficient in that it maintains steady correlation values, meaning less false signals regarding correlation. Yet, the indicator's calculation is very simple in fact...
It simply calculates the percentage of moves in the same direction as the other market. So if MSFT moved in the same direction as SPX 80% of the time, then the indicator would show you a value of 80. Unlike correlation coefficient, you can calculate exactly how many of MSFT's bars moved in the same direction as SPX's bars. Everytime MSFT moves in the same direction as SPX, it is included in the percentage of positively correlated moves.
Closing prices are used solely in the indicator's calculations. All indicator values represent a percentage. Also, I recommend a length of at least 100 periods.
Values between 0% and 25% indicate strong negative correlation. (bright red)
Values between 25% and 33% indicate moderate negative correlation. (red)
Values between 33% and 50% indicate weak negative correlation. (dark red)
Values between 50% and 67% indicate weak positive correlation. (dark green)
Values between 67% and 75% indicate moderate positive correlation. (green)
Values between 75% and 100% indicate strong positive correlation. (bright green)........Enjoy :)
Mã nguồn mở
Theo đúng tinh thần TradingView, tác giả của tập lệnh này đã công bố nó dưới dạng mã nguồn mở, để các nhà giao dịch có thể xem xét và xác minh chức năng. Chúc mừng tác giả! Mặc dù bạn có thể sử dụng miễn phí, hãy nhớ rằng việc công bố lại mã phải tuân theo Nội quy.
Thông báo miễn trừ trách nhiệm
Thông tin và các ấn phẩm này không nhằm mục đích, và không cấu thành, lời khuyên hoặc khuyến nghị về tài chính, đầu tư, giao dịch hay các loại khác do TradingView cung cấp hoặc xác nhận. Đọc thêm tại Điều khoản Sử dụng.