OPEN-SOURCE SCRIPT
Plot Closed Candles Only
What It Does:
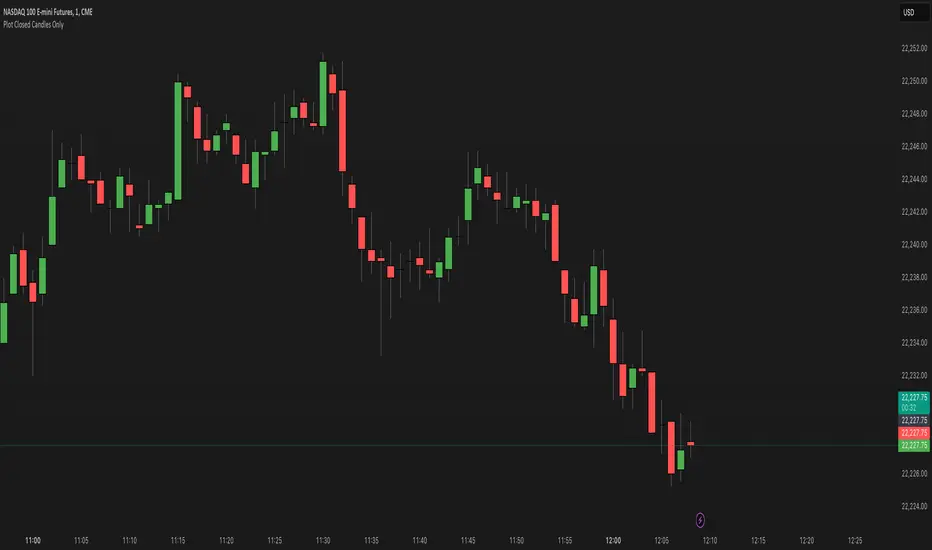
This indicator helps you see candlesticks on your chart only after they are fully closed. It colors the candles based on whether they are bullish (green), bearish (red), or neutral (black/Doji). This way, you can focus on confirmed price movements without the distraction of candles that are still forming.
Key Features:
How to Use:
Why Use It?:
This indicator helps you see candlesticks on your chart only after they are fully closed. It colors the candles based on whether they are bullish (green), bearish (red), or neutral (black/Doji). This way, you can focus on confirmed price movements without the distraction of candles that are still forming.
Key Features:
- Plots Confirmed Candles: Only shows candles after they are fully formed.
Custom Colors: - Green: Bullish candles (close > open).
- Red: Bearish candles (close < open).
- Black: Doji candles (close = open).
- Easy to Use: Simply add the indicator to your chart.
How to Use:
- Add the indicator to your chart.
- Turn off the default candles by:
- Right-clicking on the chart.
- Going to Style > Candles.
- Disabling borders, bodies, and wicks for the default candles.
- Enjoy a cleaner view of confirmed candles with clear color coding!
Why Use It?:
- Helps you focus on confirmed price action.
- Makes it easier to spot bullish, bearish, and neutral candles.
- Great for traders who want to avoid the noise of incomplete candles.
Mã nguồn mở
Theo đúng tinh thần TradingView, tác giả của tập lệnh này đã công bố nó dưới dạng mã nguồn mở, để các nhà giao dịch có thể xem xét và xác minh chức năng. Chúc mừng tác giả! Mặc dù bạn có thể sử dụng miễn phí, hãy nhớ rằng việc công bố lại mã phải tuân theo Nội quy.
Thông báo miễn trừ trách nhiệm
Thông tin và các ấn phẩm này không nhằm mục đích, và không cấu thành, lời khuyên hoặc khuyến nghị về tài chính, đầu tư, giao dịch hay các loại khác do TradingView cung cấp hoặc xác nhận. Đọc thêm tại Điều khoản Sử dụng.