OPEN-SOURCE SCRIPT
Market Phases (ZigZag + MA + RSI)
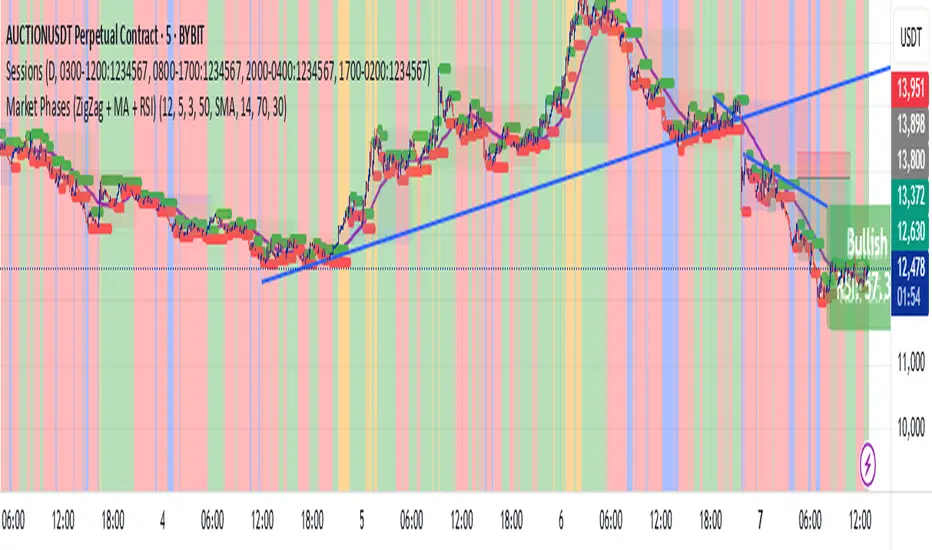
This script is a TradingView Pine Script that visualizes market phases using the ZigZag pattern, Moving Averages (MA), and the Relative Strength Index (RSI). It allows traders to identify key market conditions, such as accumulating, distributing, bullish, and bearish phases based on price movements and momentum indicators.
#### Components
1. ZigZag Settings:
- Depth: Controls the sensitivity of the ZigZag indicator. A higher value results in fewer price points being considered as reversals.
- Deviation: Defines the minimum percentage change needed to identify a ZigZag point, preventing small fluctuations from being registered.
- Backstep: Specifies the number of bars to look back for identifying highs and lows.
2. Moving Average Settings:
- MA Length: The number of periods used to calculate the moving average.
- MA Type: The type of moving average to use, either Simple Moving Average (SMA) or Exponential Moving Average (EMA).
3. RSI Settings:
- RSI Length: The period for calculating the RSI.
- Overbought Level: The threshold above which the asset is considered overbought.
- Oversold Level: The threshold below which the asset is considered oversold.
4. Calculations:
- Moving Average and RSI Calculation: The script calculates either an SMA or EMA and the RSI based on user-defined settings.
5. ZigZag Enhanced Calculation:
- It identifies swing highs and lows to determine the ZigZag points for improved trend analysis.
6. Trend Direction:
- The script checks the direction of the trend based on the latest ZigZag points.
7. Market Phase Determination:
- The script defines the market phase (Accumulation, Distribution, Bullish, Bearish) based on the trend direction and levels from the RSI and relationship with the moving average.
8. Background Colors:
- The background is tinted according to the identified market phase for visual clarity.
9. Labels and Plotting:
- Labels are generated at the last bar with the current phase and RSI value.
- The moving average and last ZigZag points are plotted on the chart for further reference.
### Conclusion
This script provides a comprehensive view of market conditions by integrating multiple indicators, helping traders make informed trading decisions based on market dynamics. The ability to visualize phases and key indicators aids in recognizing potential entry and exit points in trading strategies.
If you have any questions or need further modifications, feel free to ask!
Mã nguồn mở
Theo đúng tinh thần TradingView, tác giả của tập lệnh này đã công bố nó dưới dạng mã nguồn mở, để các nhà giao dịch có thể xem xét và xác minh chức năng. Chúc mừng tác giả! Mặc dù bạn có thể sử dụng miễn phí, hãy nhớ rằng việc công bố lại mã phải tuân theo Nội quy.
Thông báo miễn trừ trách nhiệm
Thông tin và các ấn phẩm này không nhằm mục đích, và không cấu thành, lời khuyên hoặc khuyến nghị về tài chính, đầu tư, giao dịch hay các loại khác do TradingView cung cấp hoặc xác nhận. Đọc thêm tại Điều khoản Sử dụng.