OPEN-SOURCE SCRIPT
Cập nhật Accumulation/Distribution Bands & Signals (BTC, 1D, BITSTAMP)

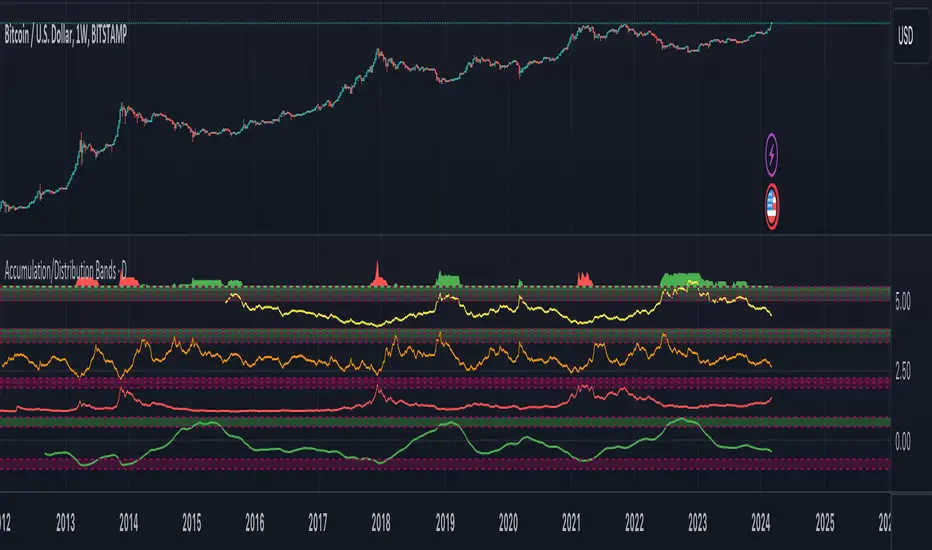
This is an accumulation/distribution indicator for BTC/USD (D) based on variations of 1400D and 120D moving averages and logarithmic regression. Yellow plot signals Long Term Accumulation, which is based on 1400D (200W) ALMA, orange plot signals Mid Term Accumulation and is based on 120D ALMA, and finally the red plot signals Long Term Distribution that's based on log regression. It should be noted that for red plot to work BTC 1D BITSTAMP graph must be used, because the function of the logarithmic regression was modified according to the x axis of the BITSTAMP data.
Signal bands have different coefficients; long term accumulation (yellow) and and the log regression (red) plots have the highest coefficients and mid term accumulation (orange) has the lowest coefficients. Coefficients are 6x, 3x and 1.5x for the red (sell) and yellow (buy) plots and 1x, 2x and 3x for the orange (buy) plot. Selling coefficient for the yellow and the orange plots are respectively 2x and 1x. Buy and sell signals are summed up accordingly and plotted at the top of the highest band.
Acknowledgement: Credits for the logarithmic regression function are due memotyka9009 and Benjamin Cowen
Phát hành các Ghi chú
Updated accumulation/distribution bands now also includes a modified pi cycle top indicator which is used for both sell and buy signals. Additionally some parameters were readjusted.Buy or sell a certain percentage (up to you to decide the exact value) of your BTC weekly depending on the intensity of accumulation/distribution signals!
Phát hành các Ghi chú
Note: You can use the indicator in any timeframe of 1D, 1W or 1M depending on how frequently you want to accumulate or distribute, the indicator is for long term investments. For mid term investing you can use the Trend Identifier, while shorter term indicators will be published later.Phát hành các Ghi chú
Please use Mã nguồn mở
Theo đúng tinh thần TradingView, tác giả của tập lệnh này đã công bố nó dưới dạng mã nguồn mở, để các nhà giao dịch có thể xem xét và xác minh chức năng. Chúc mừng tác giả! Mặc dù bạn có thể sử dụng miễn phí, hãy nhớ rằng việc công bố lại mã phải tuân theo Nội quy.
Thông báo miễn trừ trách nhiệm
Thông tin và các ấn phẩm này không nhằm mục đích, và không cấu thành, lời khuyên hoặc khuyến nghị về tài chính, đầu tư, giao dịch hay các loại khác do TradingView cung cấp hoặc xác nhận. Đọc thêm tại Điều khoản Sử dụng.
Mã nguồn mở
Theo đúng tinh thần TradingView, tác giả của tập lệnh này đã công bố nó dưới dạng mã nguồn mở, để các nhà giao dịch có thể xem xét và xác minh chức năng. Chúc mừng tác giả! Mặc dù bạn có thể sử dụng miễn phí, hãy nhớ rằng việc công bố lại mã phải tuân theo Nội quy.
Thông báo miễn trừ trách nhiệm
Thông tin và các ấn phẩm này không nhằm mục đích, và không cấu thành, lời khuyên hoặc khuyến nghị về tài chính, đầu tư, giao dịch hay các loại khác do TradingView cung cấp hoặc xác nhận. Đọc thêm tại Điều khoản Sử dụng.