MRT, Barcolor for Trend Direction
1- This is
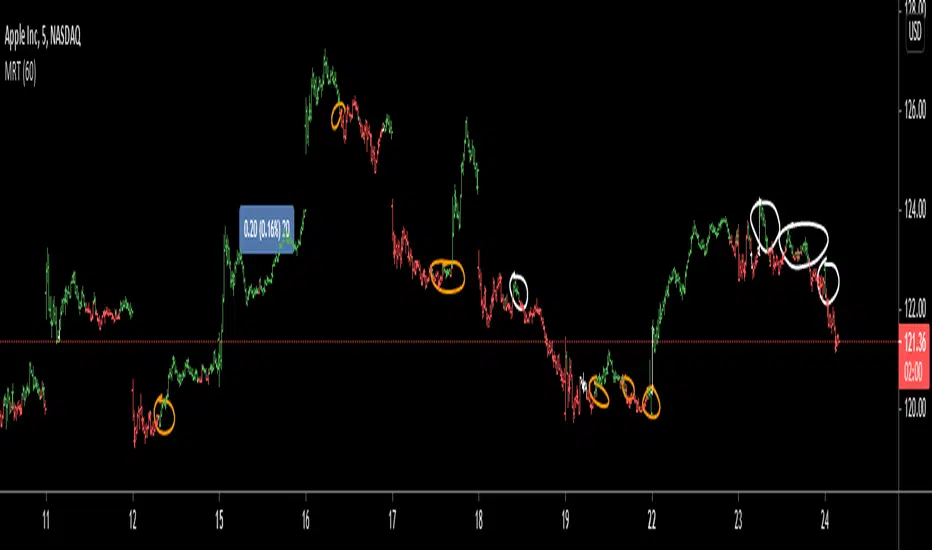
A-Yellow Circles on the chart: Green is a Buy ,Red is a Sell
B-The white bars are transition to to the opposite color (red to green or vic versa ) it can serve as a warning of trend change.
C-As with any signal , sometimes it is a false signal (the white circles you see there). However, I would stick to the signal each time it changes.
2-The indicator uses previous highs and lows based on different time frames that you select. and calculate the winners and losers.
3-
A-I personally choose shorter time frame ( Hour, 30 minutes, even 1 minute) because I want faster signals to trade short term.
B-However, you can use it for longer term if you trade on longer time frames.
c-Whatever timeframe you use , choose lower for the candle; For example, if you use the One-Hour for the indicator then apply it to the five minutes chart. I use the 30 seconds chart.
4-This indicator will not guarantee any returns.
comment if you have any question.
Tập lệnh chỉ hiển thị cho người được mời
Chỉ những người dùng được tác giả đồng ý mới có thể truy cập tập lệnh này. Bạn cần yêu cầu và xin phép sử dụng tập lệnh này. Quyền truy cập thường được cấp sau khi thanh toán. Để biết thêm chi tiết, hãy làm theo hướng dẫn của tác giả bên dưới hoặc liên hệ trực tiếp với malrawi.
TradingView KHÔNG khuyến khích trả tiền hoặc sử dụng tập lệnh trừ khi bạn hoàn toàn tin tưởng tác giả và hiểu cách hoạt động của tập lệnh. Bạn cũng có thể tìm thấy các giải pháp thay thế miễn phí, mã nguồn mở trong mục tập lệnh cộng đồng của chúng tôi.
Hướng dẫn của tác giả
Thông báo miễn trừ trách nhiệm
Tập lệnh chỉ hiển thị cho người được mời
Chỉ những người dùng được tác giả đồng ý mới có thể truy cập tập lệnh này. Bạn cần yêu cầu và xin phép sử dụng tập lệnh này. Quyền truy cập thường được cấp sau khi thanh toán. Để biết thêm chi tiết, hãy làm theo hướng dẫn của tác giả bên dưới hoặc liên hệ trực tiếp với malrawi.
TradingView KHÔNG khuyến khích trả tiền hoặc sử dụng tập lệnh trừ khi bạn hoàn toàn tin tưởng tác giả và hiểu cách hoạt động của tập lệnh. Bạn cũng có thể tìm thấy các giải pháp thay thế miễn phí, mã nguồn mở trong mục tập lệnh cộng đồng của chúng tôi.