OPEN-SOURCE SCRIPT
Cập nhật SMA Ichimoku Crosses
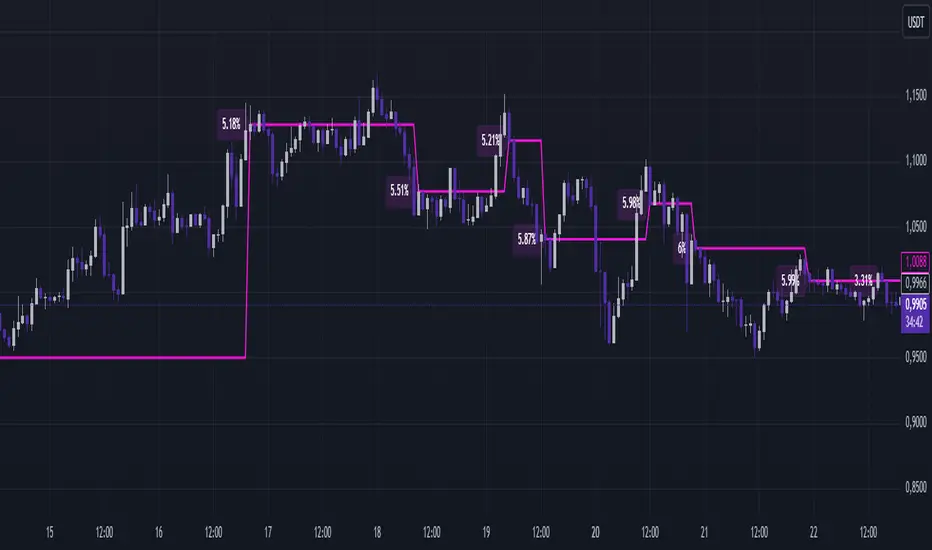
SMA Ichimoku Crosses displays the moving average between the last two crossings of the Tenkan-Sen and Kijun-Sen lines from Ichimoku Kinko Hyo. The line is calculated based on the closing prices at the time of the crossings and is added directly to the price chart, making it a convenient tool for trend analysis and identifying entry and exit points.
Features:
- Automatic calculation of Tenkan-Sen and Kijun-Sen lines.
- Fixation of closing prices at the point of line crossings.
- Calculation of the average price between the last two crossings.
- Display of a pink line on the price chart for convenient analysis.
How to use:
- Identify potential trend reversal zones by observing the line’s position relative to the price.
- Use the line as a dynamic level of support or resistance.
- Include the indicator in your Ichimoku strategies to enhance the accuracy of signals.
Suitable for:
- Traders using Ichimoku in their trading.
- Trend analysis enthusiasts.
- Those looking for additional filters for entry and exit points.
Phát hành các Ghi chú
Price Maximum Deviation Analysis:Added calculation of the maximum percentage deviation of the price from the SMA (between Ichimoku crosses).
Helps assess volatility and identify potential risk levels.
Deviation History Storage:
Introduced the ability to analyze maximum deviations over recent periods (parameter Number of Breaks).
Deviation data is stored, allowing better analysis of price behavior over time.
Dynamic SMA Update:
The average price (avgPrice) is now fixed at the crossover point and used for subsequent calculations.
This helps to more accurately identify key levels on the chart.
Deviation Labels Display:
At each crossover, the indicator now displays a label showing the average maximum deviation over the selected period.
Provides a clear visual representation of market volatility.
This update makes the indicator more informative and useful for analyzing market conditions.
Mã nguồn mở
Theo đúng tinh thần TradingView, tác giả của tập lệnh này đã công bố nó dưới dạng mã nguồn mở, để các nhà giao dịch có thể xem xét và xác minh chức năng. Chúc mừng tác giả! Mặc dù bạn có thể sử dụng miễn phí, hãy nhớ rằng việc công bố lại mã phải tuân theo Nội quy.
Thông báo miễn trừ trách nhiệm
Thông tin và các ấn phẩm này không nhằm mục đích, và không cấu thành, lời khuyên hoặc khuyến nghị về tài chính, đầu tư, giao dịch hay các loại khác do TradingView cung cấp hoặc xác nhận. Đọc thêm tại Điều khoản Sử dụng.