OPEN-SOURCE SCRIPT
FVG within Specific NY Time
Disclaimer: This indicator is designed solely for educational and informational purposes. The creator assumes no liability for any financial losses incurred as a result of utilizing this indicator or strategy. Users are advised to exercise discretion and consult with a professional advisor before engaging in trading based on this tool.
Strategy Overview
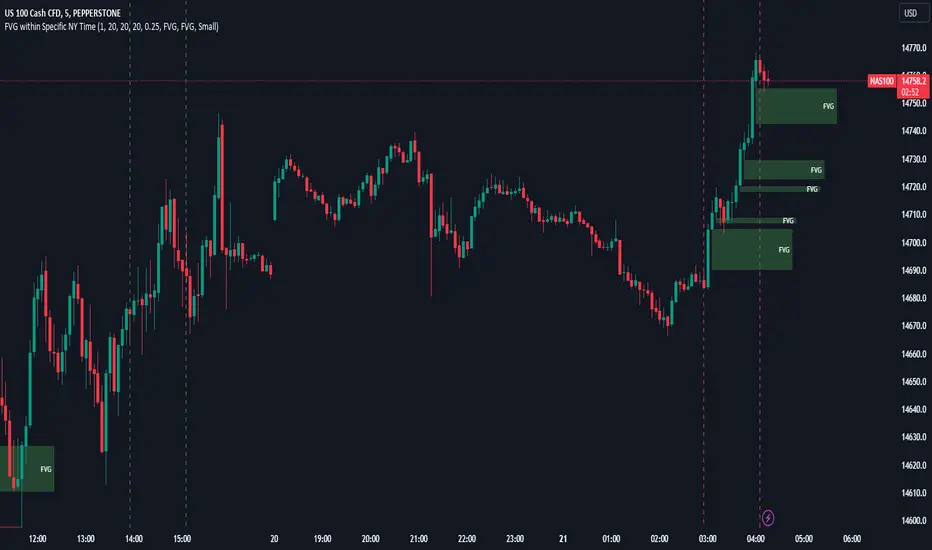
This strategy focuses on pinpointing unfilled Fixed Value Gaps (FVGs) within a five-minute timeframe during predetermined intervals throughout the day, which we term "Liquidity Injection Intervals." The concept of this strategy is that unfilled FVGs in these intervals will likely be tested before continuation of the trend.
To implement this strategy:
Liquidity Injection Intervals (EST/NY Time):
How to use this Indicator
Add this indicator to your chart
Set the chart timeframe to 5m
This indicator will highlight the predefined intervals using dotted vertical lines and draw identify the FVG. Do note that this indicator does not display FVGs that have been filled. You are to manually identify the stop loss and take profit.
Feel free to use this code and adapt it to your own trading strategies. Happy trading!
Strategy Overview
This strategy focuses on pinpointing unfilled Fixed Value Gaps (FVGs) within a five-minute timeframe during predetermined intervals throughout the day, which we term "Liquidity Injection Intervals." The concept of this strategy is that unfilled FVGs in these intervals will likely be tested before continuation of the trend.
To implement this strategy:
- Identify an FVG, ideally closer to the end of the specified time interval.
Place entry orders anticipating the gap to be filled. - Set stop-loss orders at the extremity of the wick from which the FVG originated. If the FVG arises amidst a sustained directional movement, the stop should be placed at the wick of the initiating candle of that movement.
- While there is no predefined target profit (TP) for this strategy, I would advice to aim for at least a 2:1 Reward to Risk. Ensure that your TP lies within a plausible reach, considering the price action of that day.
Liquidity Injection Intervals (EST/NY Time):
- 3 AM - 4 AM
- 10 AM - 11 AM
- 2 PM - 3 PM
How to use this Indicator
Add this indicator to your chart
Set the chart timeframe to 5m
This indicator will highlight the predefined intervals using dotted vertical lines and draw identify the FVG. Do note that this indicator does not display FVGs that have been filled. You are to manually identify the stop loss and take profit.
Feel free to use this code and adapt it to your own trading strategies. Happy trading!
Mã nguồn mở
Theo đúng tinh thần TradingView, tác giả của tập lệnh này đã công bố nó dưới dạng mã nguồn mở, để các nhà giao dịch có thể xem xét và xác minh chức năng. Chúc mừng tác giả! Mặc dù bạn có thể sử dụng miễn phí, hãy nhớ rằng việc công bố lại mã phải tuân theo Nội quy.
Thông báo miễn trừ trách nhiệm
Thông tin và các ấn phẩm này không nhằm mục đích, và không cấu thành, lời khuyên hoặc khuyến nghị về tài chính, đầu tư, giao dịch hay các loại khác do TradingView cung cấp hoặc xác nhận. Đọc thêm tại Điều khoản Sử dụng.