OPEN-SOURCE SCRIPT
MAGIC MA BANDS
Magic MA Bands — Dynamic Trend Zones Instead of Lines
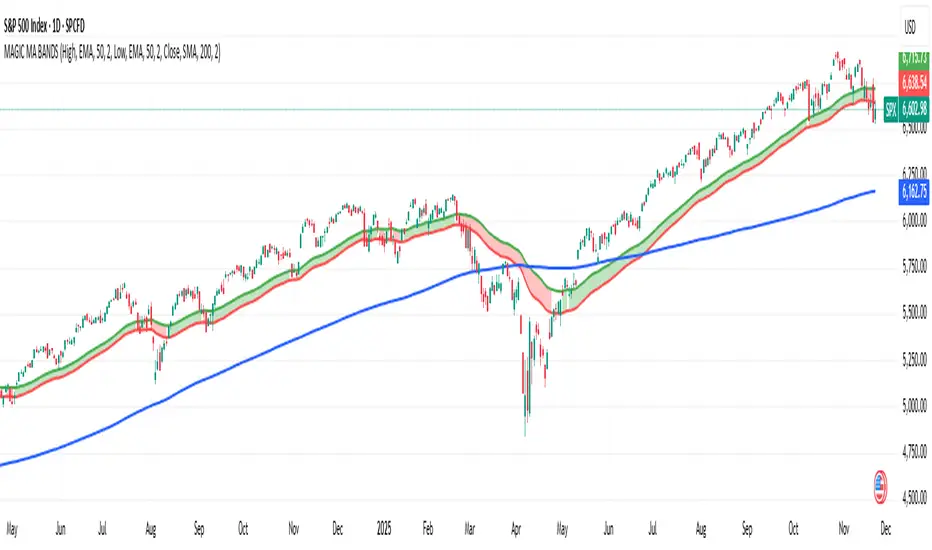
Magic MA Bands help traders visualize dynamic support and resistance zones rather than relying on a single moving average line. Instead of treating the MA as an exact reaction level, this tool creates a band or zone where price is statistically more likely to react, reverse, or continue trending.
🧠 How It Works
The script plots:
Upper Band (default: 50 EMA using High values)
Lower Band (default: 50 EMA using Low values)
Optional Midline MA (default: 200 SMA for long-term trend)
The area between the upper and lower bands becomes a trend cushion, helping traders identify:
Dynamic support/resistance zones
Trend strength and continuation probability
Ideal pullback entry regions
🎯 Trend Interpretation Guide
Use Case Recommended Setting
Short-Term Trend 20/21 EMA or SMA
Medium-Term Trend 50 EMA / SMA
Long-Term Trend 200 SMA / EMA (Midline Optional)
All parameters are fully customisable so the user can define their preferred structure based on their trading style, asset volatility, or timeframe.
✔️ Best For:
Trend traders
Swing trading
Pullback-based entries
Institutional-style zone analysis
Mã nguồn mở
Theo đúng tinh thần TradingView, tác giả của tập lệnh này đã công bố nó dưới dạng mã nguồn mở, để các nhà giao dịch có thể xem xét và xác minh chức năng. Chúc mừng tác giả! Mặc dù bạn có thể sử dụng miễn phí, hãy nhớ rằng việc công bố lại mã phải tuân theo Nội Quy.
Thông báo miễn trừ trách nhiệm
Thông tin và các ấn phẩm này không nhằm mục đích, và không cấu thành, lời khuyên hoặc khuyến nghị về tài chính, đầu tư, giao dịch hay các loại khác do TradingView cung cấp hoặc xác nhận. Đọc thêm tại Điều khoản Sử dụng.