OPEN-SOURCE SCRIPT
Cập nhật Urika Trend Strength
The Urika Directional Strength (UDS) indicator calculates and visualizes the strength of the directional trend in the price data. It helps traders see the strength and direction of the trend and allows them to make informed trading decisions based on trend changes.
Calculation:
The Simple Moving Average is used to determine the upper and lower directional bands by adding and subtracting the product of the standard deviation of the price data and the multiplier of the moving average.
Direction: The upward directional trend and downward directional trend are calculated by taking the absolute value of the difference between the price data and the upper and lower directional bands, divided by the product of the standard deviation and the multiplier.
Strength: It is calculated by taking the absolute value of the difference between the price data and the moving average, divided by the product of the standard deviation and the multiplier.
Interpretation:
Direction: The position of the long and short lines at the top indicates the direction of the ticker. Long line for long position and Short line for short position.
Strength: When the Strength line is below the directional lines, it is a weak trend or consolidating. If it stays in between the two directional lines, it is a strong trend.
Phát hành các Ghi chú
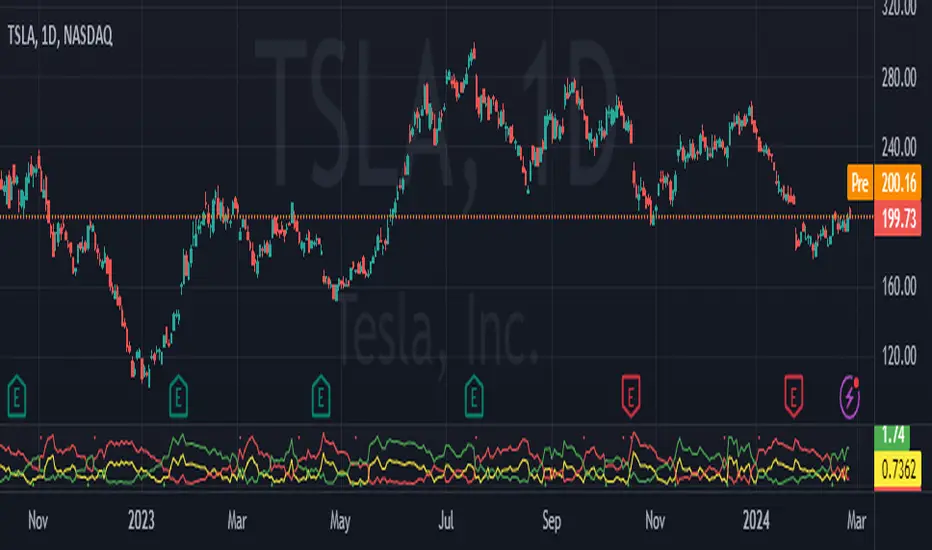
The Urika Trend Strength (UTS) indicator calculates and visualizes the strength of the directional trend in the price data. It helps traders see the strength and direction of the trend and allows them to make informed trading decisions based on trend changes.Calculation:
The Simple Moving Average is used to determine the upper and lower directional bands by adding and subtracting the product of the standard deviation of the price data and the multiplier of the moving average.
Direction: The upward directional trend and downward directional trend are calculated by taking the absolute value of the difference between the price data and the upper and lower directional bands, divided by the product of the standard deviation and the multiplier.
Strength: It is calculated by taking the absolute value of the difference between the price data and the moving average, divided by the product of the standard deviation and the multiplier.
Interpretation:
Direction: The position of the long and short lines at the top indicates the direction of the ticker. Long line for long position and Short line for short position.
Strength: When the Strength line is below the directional lines, it is a weak trend or consolidating. If it stays in between the two directional lines, it is a strong trend.
Phát hành các Ghi chú
I updated the name in the description to reflect that with the code.Mã nguồn mở
Theo đúng tinh thần TradingView, tác giả của tập lệnh này đã công bố nó dưới dạng mã nguồn mở, để các nhà giao dịch có thể xem xét và xác minh chức năng. Chúc mừng tác giả! Mặc dù bạn có thể sử dụng miễn phí, hãy nhớ rằng việc công bố lại mã phải tuân theo Nội quy.
Thông báo miễn trừ trách nhiệm
Thông tin và các ấn phẩm này không nhằm mục đích, và không cấu thành, lời khuyên hoặc khuyến nghị về tài chính, đầu tư, giao dịch hay các loại khác do TradingView cung cấp hoặc xác nhận. Đọc thêm tại Điều khoản Sử dụng.
Mã nguồn mở
Theo đúng tinh thần TradingView, tác giả của tập lệnh này đã công bố nó dưới dạng mã nguồn mở, để các nhà giao dịch có thể xem xét và xác minh chức năng. Chúc mừng tác giả! Mặc dù bạn có thể sử dụng miễn phí, hãy nhớ rằng việc công bố lại mã phải tuân theo Nội quy.
Thông báo miễn trừ trách nhiệm
Thông tin và các ấn phẩm này không nhằm mục đích, và không cấu thành, lời khuyên hoặc khuyến nghị về tài chính, đầu tư, giao dịch hay các loại khác do TradingView cung cấp hoặc xác nhận. Đọc thêm tại Điều khoản Sử dụng.