OPEN-SOURCE SCRIPT
AlgoPilotX – FibFusion Confluence PRO

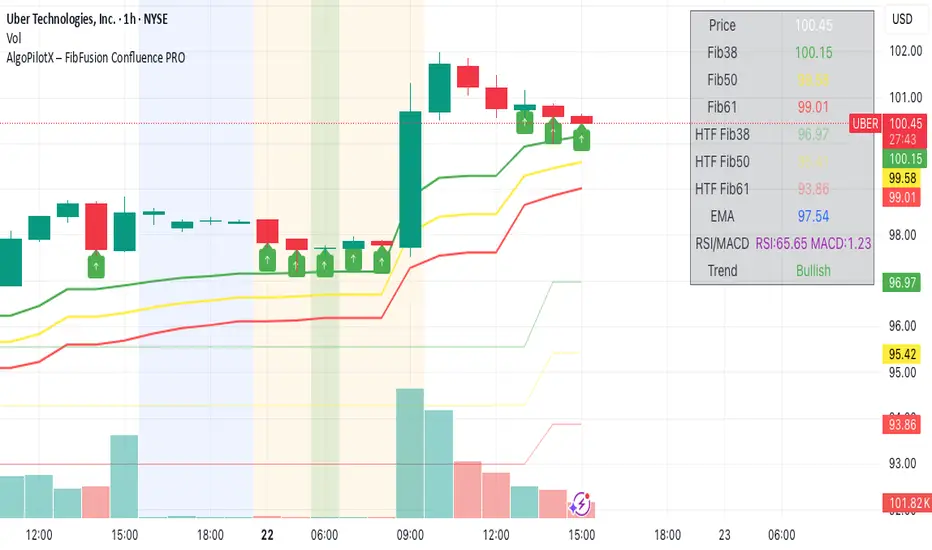
Take your Fibonacci trading to the next level with AlgoPilotX – FibFusion Confluence PRO. This advanced TradingView indicator combines multi-timeframe Fibonacci retracements with key technical indicators to identify high-probability trading zones.
Features:
Detects TF and Higher Timeframe (HTF) Fibonacci levels automatically.
Highlights Fib confluence zones with background colors for bullish and bearish probabilities.
Displays arrows on exact Fib touches for quick visual cues.
Integrated EMA, RSI, and MACD analysis to improve trend accuracy.
Dynamic Trend Indicator: Bullish, Bearish, or Neutral.
Interactive dashboard showing all key levels and indicators in real-time with intuitive color coding.
Supports multiple chart timeframes and recalculates trend and confluence dynamically.
Alerts for high probability bullish or bearish zones, ready to integrate into your trading strategy.
How to Use:
Observe price approaching Fibonacci levels displayed as lines and arrows.
Confluence Zones:
Green background: High-probability bullish zone.
Red background: High-probability bearish zone.
Neutral: No strong confluence.
Confirm signals using EMA, RSI, and MACD.
Use the dashboard to track all key levels, multi-timeframe Fibs, and current Trend.
Enter trades near high-probability confluence zones and manage risk accordingly.
Perfect for swing traders, day traders, and anyone using Fibonacci retracements to find precise entry and exit points.
Mã nguồn mở
Theo đúng tinh thần TradingView, người tạo ra tập lệnh này đã biến tập lệnh thành mã nguồn mở để các nhà giao dịch có thể xem xét và xác minh công năng. Xin dành lời khen tặng cho tác giả! Mặc dù bạn có thể sử dụng miễn phí, nhưng lưu ý nếu đăng lại mã, bạn phải tuân theo Quy tắc nội bộ của chúng tôi.
Thông báo miễn trừ trách nhiệm
Thông tin và ấn phẩm không có nghĩa là và không cấu thành, tài chính, đầu tư, kinh doanh, hoặc các loại lời khuyên hoặc khuyến nghị khác được cung cấp hoặc xác nhận bởi TradingView. Đọc thêm trong Điều khoản sử dụng.