OPEN-SOURCE SCRIPT
Cập nhật Relative Momentum Index
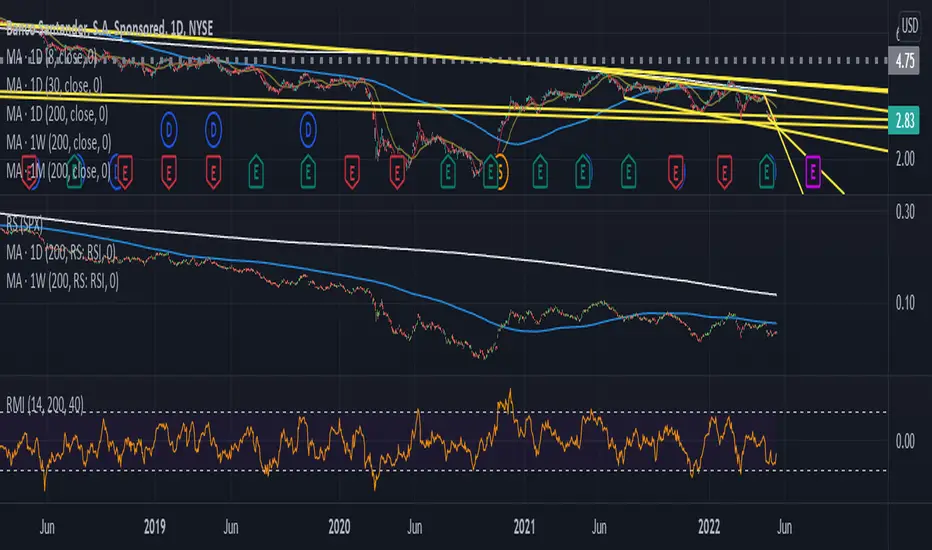
The RMI indicator is intended as a general upgrade to the RSI indicator based on logical improvements to the underlying mathematics of the RSI function.
The first change is that the RMI indicator uses the maximal change in price in both directions rather than simply the change in the closing price to better capture the relative momentum in each direction. The second change is that the the ratio between bullishness and bearishness is passed through a log function rather than the 1/(1+x) function to remove the processing artefacts caused by the EMAs and the compression within the restricted range. As a result, the RMI is an unbounded centred oscillator, although it is usually at a similar value to the RSI indicator doubled and centred at zero. The bands are intended to make differences between values more visible at a glance and for interface familiarity with the RSI indicator, though their levels are arbitrary and not intended as overbought/oversold signals.
The practical effect of these changes are that divergences are easier to see since the indicator is not compressed at extreme values and divergence strategies based on the RMI indicator are slightly more accurate. The list of occasions on the included DJI Weekly chart where the RMI divergence strategy correctly predicted a reversal while the RSI did not are as follows: July 1932, June 1962, May 1970, November 1987, May 2021
Phát hành các Ghi chú
Algorithm is more similar to the ATR algorithm it was inspired by and has an improvement in the way gaps are interpreted.Mã nguồn mở
Theo đúng tinh thần TradingView, tác giả của tập lệnh này đã công bố nó dưới dạng mã nguồn mở, để các nhà giao dịch có thể xem xét và xác minh chức năng. Chúc mừng tác giả! Mặc dù bạn có thể sử dụng miễn phí, hãy nhớ rằng việc công bố lại mã phải tuân theo Nội quy.
Thông báo miễn trừ trách nhiệm
Thông tin và các ấn phẩm này không nhằm mục đích, và không cấu thành, lời khuyên hoặc khuyến nghị về tài chính, đầu tư, giao dịch hay các loại khác do TradingView cung cấp hoặc xác nhận. Đọc thêm tại Điều khoản Sử dụng.
Mã nguồn mở
Theo đúng tinh thần TradingView, tác giả của tập lệnh này đã công bố nó dưới dạng mã nguồn mở, để các nhà giao dịch có thể xem xét và xác minh chức năng. Chúc mừng tác giả! Mặc dù bạn có thể sử dụng miễn phí, hãy nhớ rằng việc công bố lại mã phải tuân theo Nội quy.
Thông báo miễn trừ trách nhiệm
Thông tin và các ấn phẩm này không nhằm mục đích, và không cấu thành, lời khuyên hoặc khuyến nghị về tài chính, đầu tư, giao dịch hay các loại khác do TradingView cung cấp hoặc xác nhận. Đọc thêm tại Điều khoản Sử dụng.