OPEN-SOURCE SCRIPT
Cập nhật Smash + Proba + BF
This script is designed to automatically display various levels that can be useful for trading.
These levels must be entered in the script as parameters in the form of lists separated by semicolons (";").
There are three groups of levels:

These levels must be entered in the script as parameters in the form of lists separated by semicolons (";").
There are three groups of levels:
- Smash: Levels provided in the Smashelito newsletter
- Proba: Probability levels (50% and 70%) of reaching certain price points, calculated using options data
- BF: Option-related levels provided by Krechendo Connect / BlackFlag
Example :
Phát hành các Ghi chú
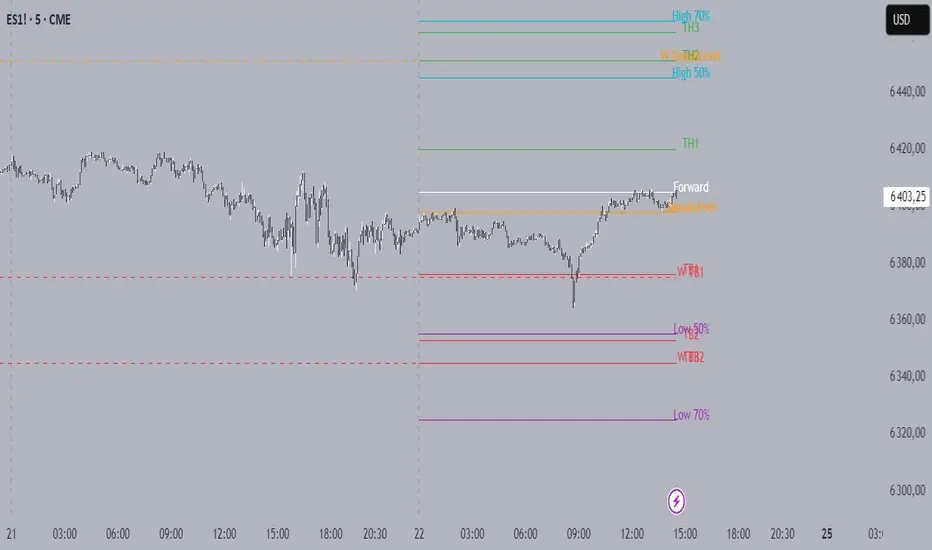
A comprehensive multi-timeframe support and resistance indicator that displays key trading levels across daily and weekly timeframes.Features
Daily Levels (Solid Lines)
Smash Level: Key breakout/breakdown level (Orange)
Target High 1-3 (TH1-TH3): Upside targets (Green)
Target Low 1-3 (TB1-TB3): Downside targets (Red)
Weekly Levels (Dashed Lines)
Same structure as daily levels but displayed across the entire current week
Semi-transparent styling for clear distinction from daily levels
Probability Levels
High 70%/50%: Upper probability zones (Aqua)
Low 50%/70%: Lower probability zones (Purple)
Book Flow (BF) Levels
Call Resistance: Key call option resistance levels (Lime)
Put Support: Key put option support levels (Red)
Dominant Buy/Sell: Order flow dominance levels (Green/Red)
HVL (High Volume Levels): Both regular and 0DTE versions (Blue)
1D Min/Max: Daily range extremes (Yellow)
Gamma Wall: Critical gamma hedging levels (Aqua)
Input Format
Enter levels separated by semicolons (;) in the format: Level1;Level2;Level3;etc.
Usage
Perfect for traders who need to track multiple support/resistance levels across different timeframes and market dynamics. The indicator automatically updates and extends lines as new bars form, providing real-time level tracking with clear visual differentiation between daily and weekly levels.
Phát hành các Ghi chú
# Smash + Proba + BF Levels IndicatorA comprehensive multi-timeframe support and resistance indicator that displays key trading levels across daily and weekly timeframes.
## Features
### Daily Levels (Solid Lines)
- **Smash Level**: Key breakout/breakdown level (Orange)
- **Target High 1-3 (TH1-TH3)**: Upside targets (Green)
- **Target Low 1-3 (TB1-TB3)**: Downside targets (Red)
### Weekly Levels (Dashed Lines)
- Same structure as daily levels but displayed across the entire current week
- Semi-transparent styling for clear distinction from daily levels
### Probability Levels
- **High 70%/50%**: Upper probability zones (Aqua)
- **Low 50%/70%**: Lower probability zones (Purple)
### Book Flow (BF) Levels
- **Call Resistance**: Key call option resistance levels (Lime)
- **Put Support**: Key put option support levels (Red)
- **Dominant Buy/Sell**: Order flow dominance levels (Green/Red)
- **HVL (High Volume Levels)**: Both regular and 0DTE versions (Blue)
- **1D Min/Max**: Daily range extremes (Yellow)
- **Gamma Wall**: Critical gamma hedging levels (Aqua)
## Input Format
Enter levels separated by semicolons (;) in the format: `Level1;Level2;Level3;etc.`
## Usage
Perfect for traders who need to track multiple support/resistance levels across different timeframes and market dynamics. The indicator automatically updates and extends lines as new bars form, providing real-time level tracking with clear visual differentiation between daily and weekly levels.
Mã nguồn mở
Theo đúng tinh thần TradingView, tác giả của tập lệnh này đã công bố nó dưới dạng mã nguồn mở, để các nhà giao dịch có thể xem xét và xác minh chức năng. Chúc mừng tác giả! Mặc dù bạn có thể sử dụng miễn phí, hãy nhớ rằng việc công bố lại mã phải tuân theo Nội quy.
Thông báo miễn trừ trách nhiệm
Thông tin và các ấn phẩm này không nhằm mục đích, và không cấu thành, lời khuyên hoặc khuyến nghị về tài chính, đầu tư, giao dịch hay các loại khác do TradingView cung cấp hoặc xác nhận. Đọc thêm tại Điều khoản Sử dụng.