OPEN-SOURCE SCRIPT
Phaser [QuantVue]
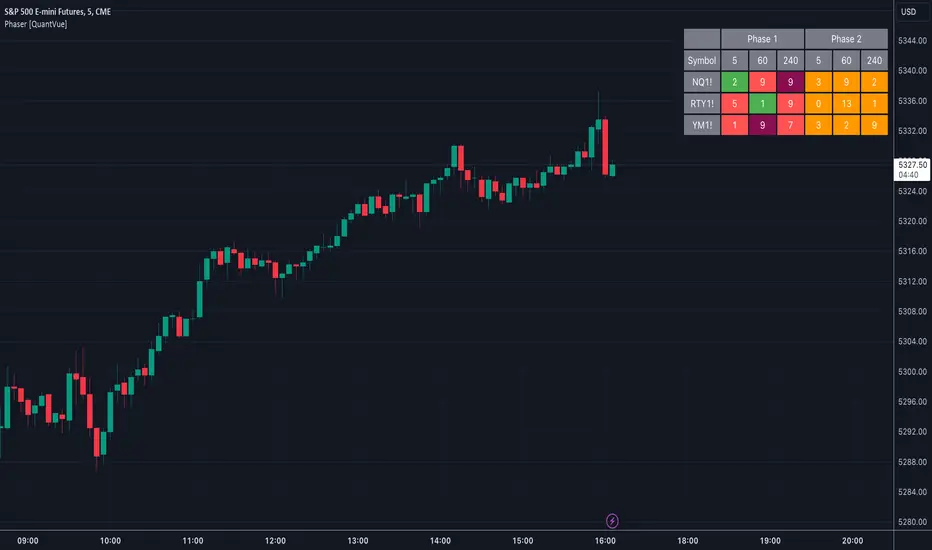
The Phaser indicator is a tool to help identify inflection points by looking at price relative to past prices across multiple timeframes and assets.
Phase 1 looks for the price to be higher or lower than the closing price of the bar 4 bars earlier and is complete when 9 consecutive bars meet this criterion.
A completed Phase 1 is considered perfect when the highs (bearish) or lows (bullish) have been exceeded from bars 6 and 7 of the phase.
A bullish setup requires 9 consecutive closes less than the close 4 bars earlier.

A bearish setup requires 9 consecutive closes greater than the close 4 bars earlier.

Phase 2 begins once Phase 1 has been completed. Phase 2 compares the current price to the high or low of two bars earlier.
Unlike Phase 1, Phase 2 does not require the count to be consecutive.
Phase 2 is considered complete when 13 candles have met the criteria.
An important aspect to Phase 2 is the relationship between bar 13 and bar 8.
To ensure the end of Phase 2 is in line with the existing trend, the high or low of bar 13 is compared to the close of bar 8.
A bullish imperfect 13 occurs when the current price is less than the low of 2 bars earlier, but the current low is greater than the close of bar 8 in Phase 2.

A bearish imperfect 13 occurs when the current price is greater than the high of 2 bars earlier, but the current high is less than the close of bar 8 in Phase 2.

Phase 2 does not need to go until it is complete. A Phase 2 can be canceled if the price closes above or below the highest or lowest price from Phase 1.
Settings
Phase 1 looks for the price to be higher or lower than the closing price of the bar 4 bars earlier and is complete when 9 consecutive bars meet this criterion.
A completed Phase 1 is considered perfect when the highs (bearish) or lows (bullish) have been exceeded from bars 6 and 7 of the phase.
A bullish setup requires 9 consecutive closes less than the close 4 bars earlier.
A bearish setup requires 9 consecutive closes greater than the close 4 bars earlier.
Phase 2 begins once Phase 1 has been completed. Phase 2 compares the current price to the high or low of two bars earlier.
Unlike Phase 1, Phase 2 does not require the count to be consecutive.
Phase 2 is considered complete when 13 candles have met the criteria.
An important aspect to Phase 2 is the relationship between bar 13 and bar 8.
To ensure the end of Phase 2 is in line with the existing trend, the high or low of bar 13 is compared to the close of bar 8.
A bullish imperfect 13 occurs when the current price is less than the low of 2 bars earlier, but the current low is greater than the close of bar 8 in Phase 2.
A bearish imperfect 13 occurs when the current price is greater than the high of 2 bars earlier, but the current high is less than the close of bar 8 in Phase 2.
Phase 2 does not need to go until it is complete. A Phase 2 can be canceled if the price closes above or below the highest or lowest price from Phase 1.
Settings
- 3 Tickers
- 3 Timeframes
- Show Phase 1
- Show Phase 2
- User-selected colors
Mã nguồn mở
Theo đúng tinh thần TradingView, tác giả của tập lệnh này đã công bố nó dưới dạng mã nguồn mở, để các nhà giao dịch có thể xem xét và xác minh chức năng. Chúc mừng tác giả! Mặc dù bạn có thể sử dụng miễn phí, hãy nhớ rằng việc công bố lại mã phải tuân theo Nội quy.
Get Access to the exclusive QuantVue indicators: quantvue.io/
Join thousands of traders in our Free Discord: discord.gg/tC7u7magU3
Join thousands of traders in our Free Discord: discord.gg/tC7u7magU3
Thông báo miễn trừ trách nhiệm
Thông tin và các ấn phẩm này không nhằm mục đích, và không cấu thành, lời khuyên hoặc khuyến nghị về tài chính, đầu tư, giao dịch hay các loại khác do TradingView cung cấp hoặc xác nhận. Đọc thêm tại Điều khoản Sử dụng.