OPEN-SOURCE SCRIPT
Cập nhật Hosoda N Wave and TPs {fmz}
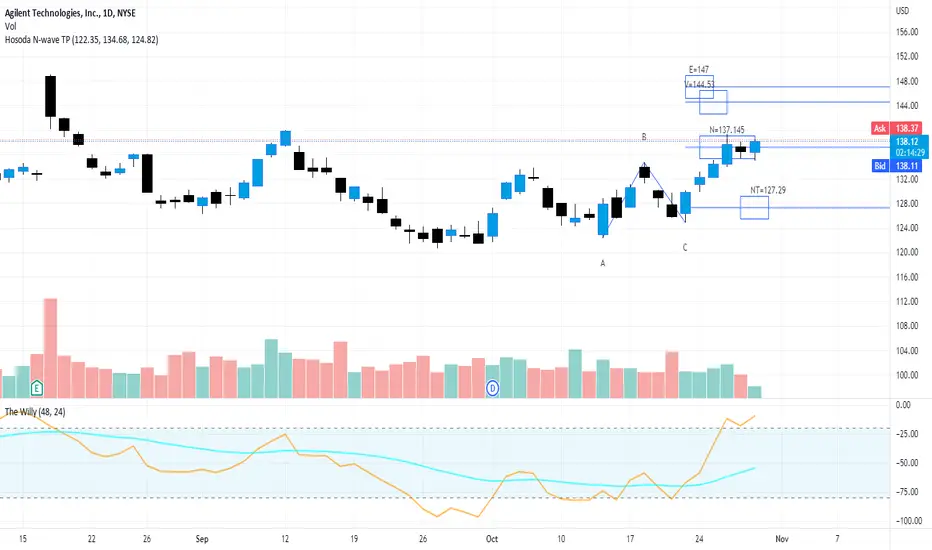
This script allows you to establish in a graphic and interactive way which are the N, NT, V and E targets for a Hosoda N wave.
Apply the indicator to the chart.
The interactive tool of Pine script version 5 will ask you to identify three points of "minimum-maximum-higher minimum" that form a bullish N wave of Hosoda (refer to the specific documentation for Hosoda N wave), or on the contrary three points "maximum-minimum-lower maximum" for a bearish N wave.
Once drawn, the price points can be moved.
When changing the market instrument, the indicator must be removed because it remains linked to the prices where it was first drawn.
Phát hành các Ghi chú
Thank to all guys that asked me to improve this script adding the time part of the theory.This new version allows from the moment in which the selected points ABC of the N wave are plotted to estimate where the objectives will be reached according to the Hosoda theory both in price and in time.
For the details of the calculation, see the references relating to the Nosoda N wave.
To use it you need to add it to the chart, the chart will ask you to choose three points (minimum-maximum minimum greater for a bullish trend, or maximum-minimum-maximum lower for a bearish trend) from which it will derive the possible targets for Hosoda.
Please check if it works well and report me in the comments if there are any problems, describing in detail the environment in which you are trying it in case you want to make reports.
Phát hành các Ghi chú
Restored lines on target with boolean to hide and show themPhát hành các Ghi chú
Conditional hide of Tp E date-time if BC>AC, the time target will be before point C. I'm curious about timing rule for choosing ABC point in Hosoda books, Anyone knows? Maybe we ave a AB time smaller than BC? So E target timing will be before C? Phát hành các Ghi chú
Allows to create a grid on time and price targets. Allows to trim horizontal lines to limit chart cluttering.Mã nguồn mở
Theo đúng tinh thần TradingView, tác giả của tập lệnh này đã công bố nó dưới dạng mã nguồn mở, để các nhà giao dịch có thể xem xét và xác minh chức năng. Chúc mừng tác giả! Mặc dù bạn có thể sử dụng miễn phí, hãy nhớ rằng việc công bố lại mã phải tuân theo Nội quy.
Thông báo miễn trừ trách nhiệm
Thông tin và các ấn phẩm này không nhằm mục đích, và không cấu thành, lời khuyên hoặc khuyến nghị về tài chính, đầu tư, giao dịch hay các loại khác do TradingView cung cấp hoặc xác nhận. Đọc thêm tại Điều khoản Sử dụng.
Mã nguồn mở
Theo đúng tinh thần TradingView, tác giả của tập lệnh này đã công bố nó dưới dạng mã nguồn mở, để các nhà giao dịch có thể xem xét và xác minh chức năng. Chúc mừng tác giả! Mặc dù bạn có thể sử dụng miễn phí, hãy nhớ rằng việc công bố lại mã phải tuân theo Nội quy.
Thông báo miễn trừ trách nhiệm
Thông tin và các ấn phẩm này không nhằm mục đích, và không cấu thành, lời khuyên hoặc khuyến nghị về tài chính, đầu tư, giao dịch hay các loại khác do TradingView cung cấp hoặc xác nhận. Đọc thêm tại Điều khoản Sử dụng.